
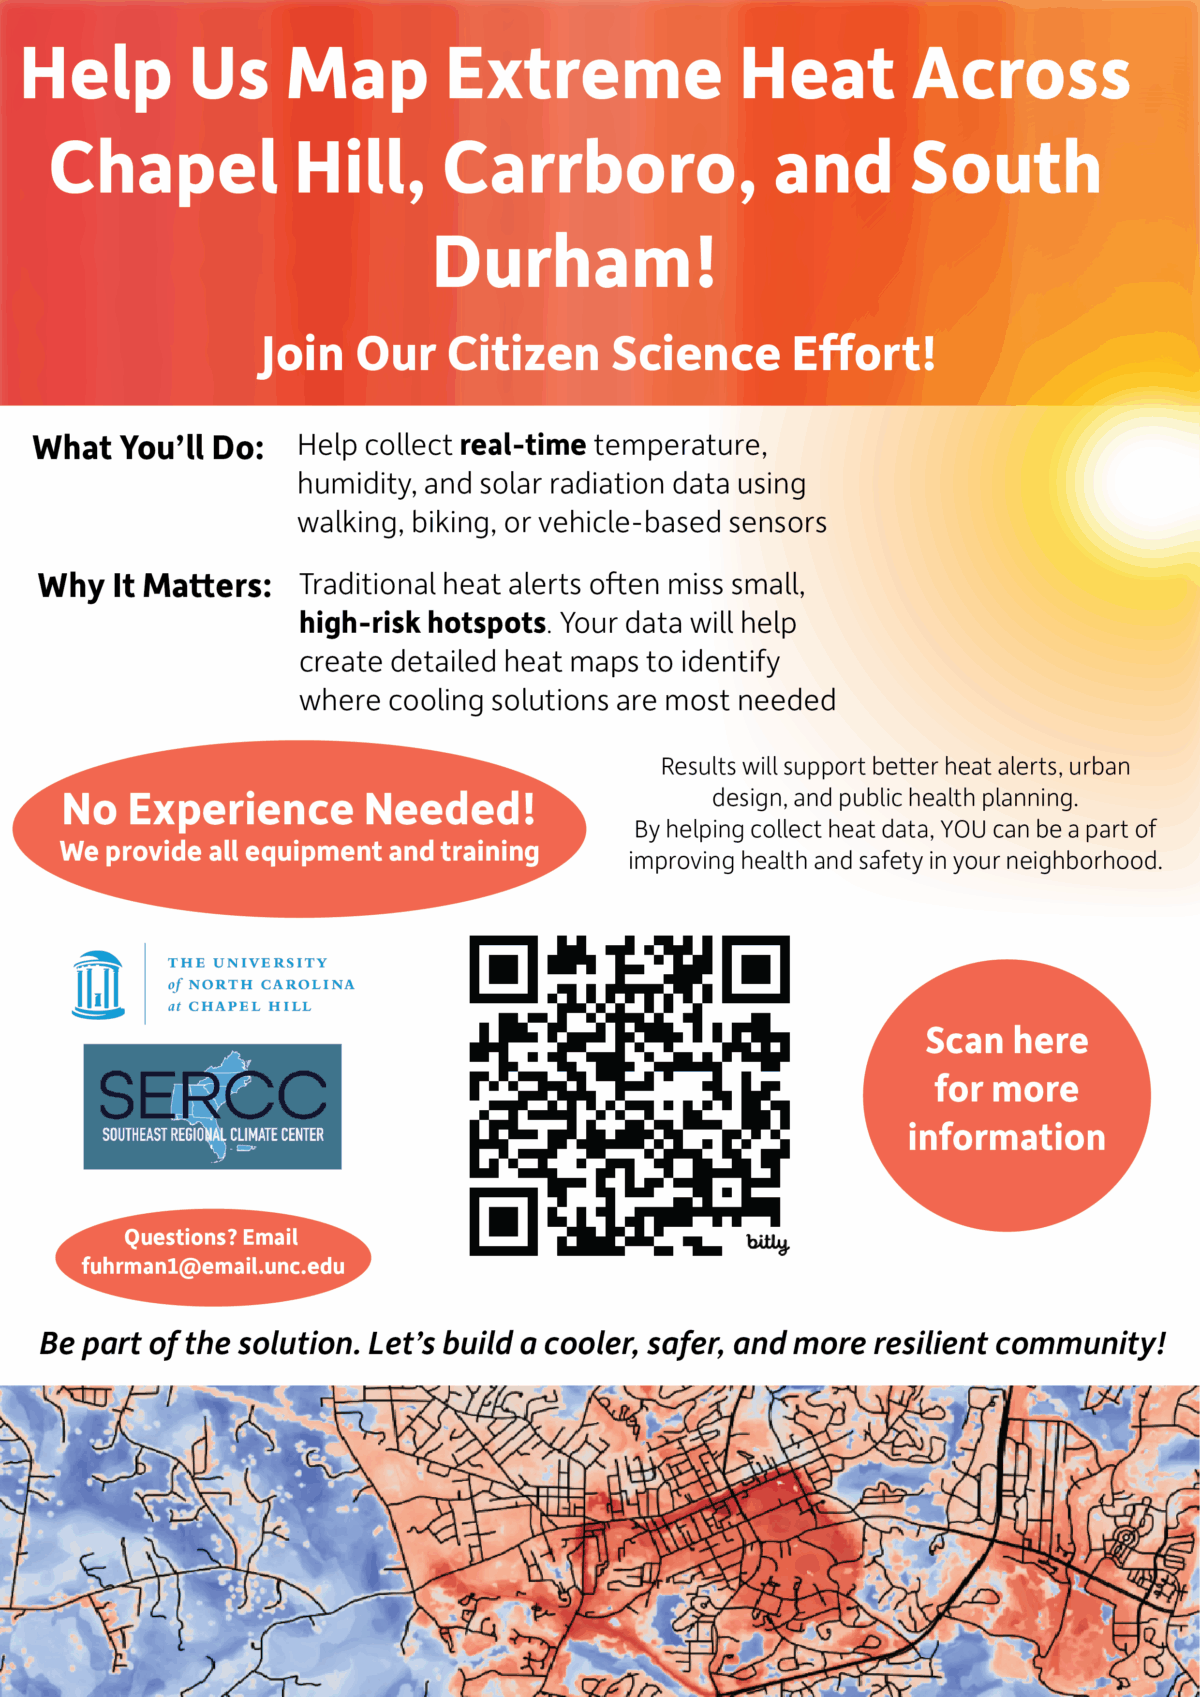
On Earth Day, I attended a community talk by the Southeast Regional Climate Center(SERCC) for the Town of Chapel Hill. The topic was their heat mapping citizen science project that is happening this Summer.
The project is a Wet-Bulb Globe Temperature Mapping Campaign across Chapel Hill, Carrboro, and South Durham. This is to help the SERCC better understand the urban heat island effect and its impact on our community. They are looking to recruit volunteers to complete either walking, biking, or driving routes to help gather weather data to model exposure to heat.
The part that really perked up my ears is the bike part. The team wants to engage the public in creating a very detailed local heat map. One part of the collection is bike based, and I totally want to get involved in that. I spoke with Chris Fuhrmann the Deputy Director & Regional Climatologist at the SERCC and one of the presenters.
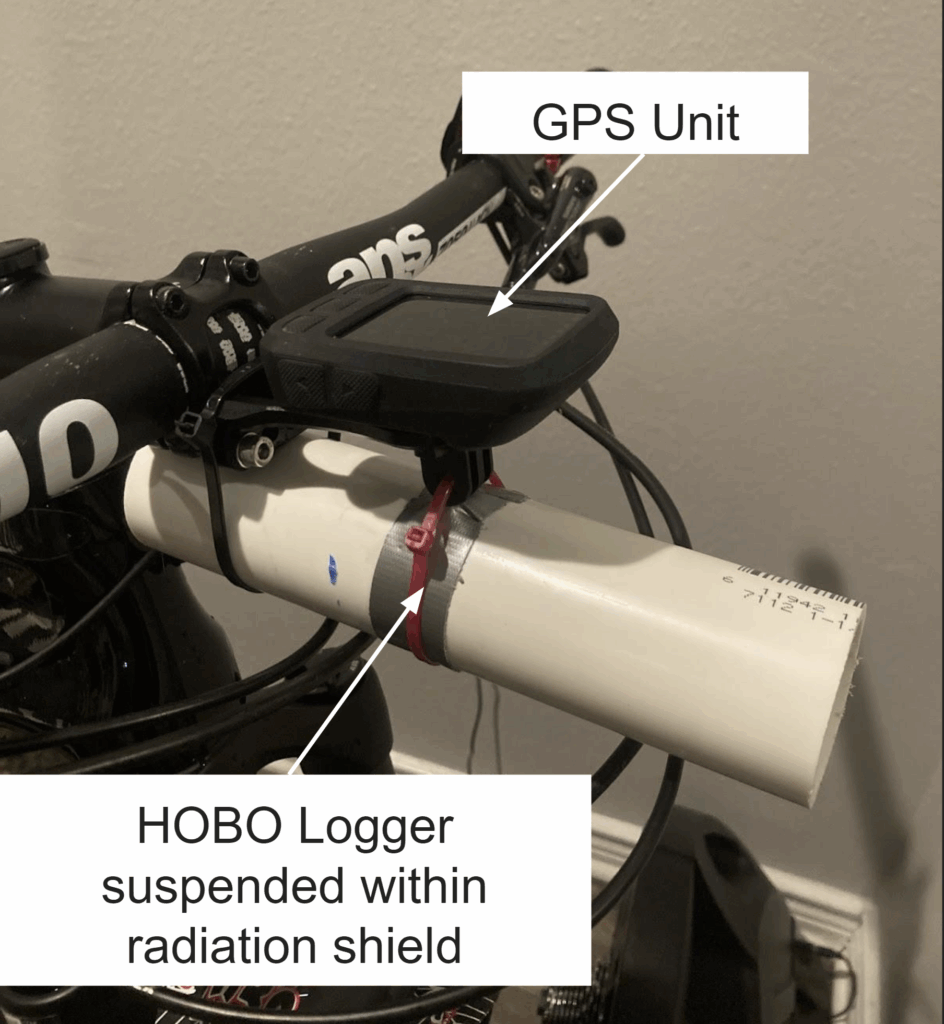
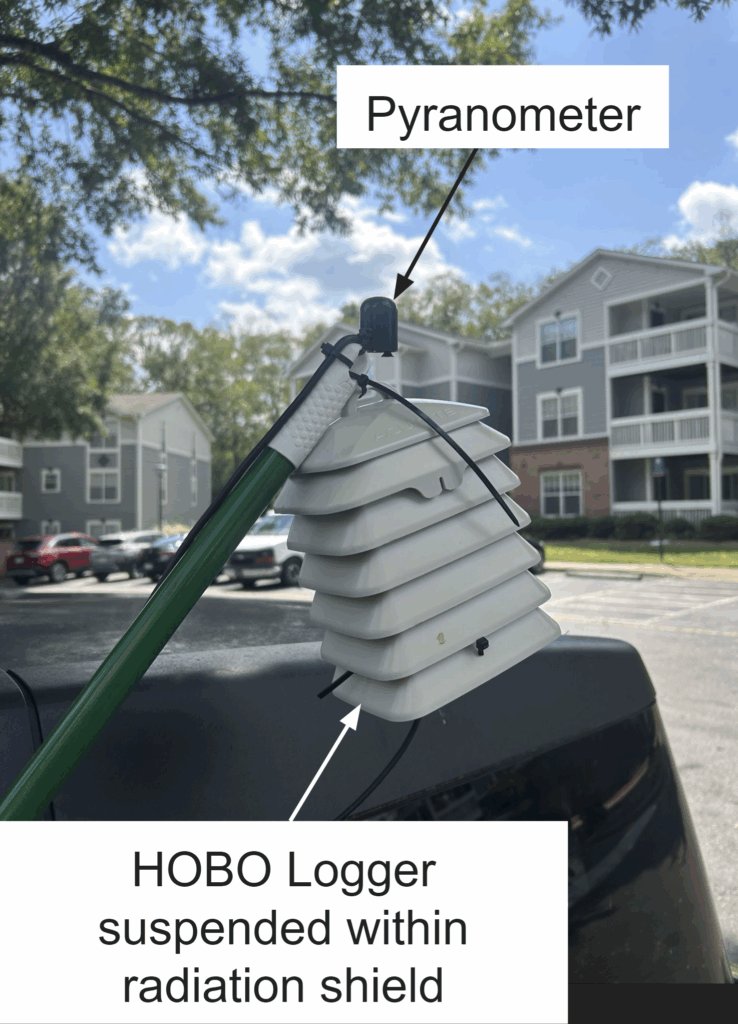
Another of their team members, Andrew Robinson has developed these custom devices that will attach to bikes to collect the data as we ride. Super cool!
As you can imagine, I was very excited about this. But even if you don’t ride bikes, there are opportunities to participate in this study.
Part of the fascinating stuff I learned about about Wet-Bulb Globe Temperature (WBGT) is that it is a way to measure the heat stress on a body that is more useful than just the temperature or the heat index.
WBGT takes into account:
- temperature
- humidity
- wind speed
- the intensity of the sunlight (i.e. sun angle and degree of cloud cover)
An example cited during the talk was how this value can be used to determine whether it is safe to conduct outdoor activities, such as sports practices. Progressive athletic departments can use WBGT to determine whether it is safe to conduct practice sessions at all or whether to shorten them, or – if possible – relocate the field being used.
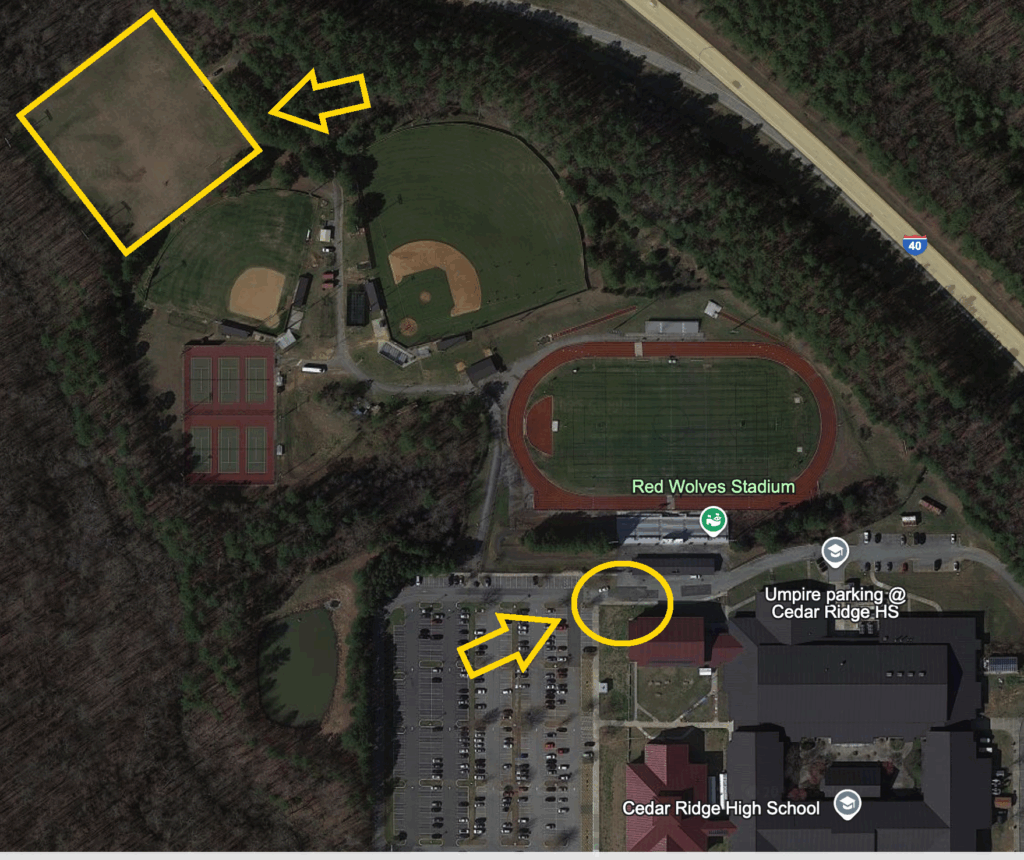
I learned that even in two points in the same area, the WBGT can vary dramatically, since factors such as wind come into play. At Cedar Ridge High school, the football practice field is downhill from the school, in an area that is surrounded by trees. This location traps humidity and blocks wind. A WBGT reading on the practice field may indicate unsafe conditions for football practice whereas a reading next to the school may look just fine.
It is because of this that the staff at the SERCC want to create more detailed heat map measurements. I am excited to participate and look forward to riding their prescribed routes to collect data. This sounds like an awesome citizen science activity to engage in yourself or with the emerging scientists in your family.
So, take a look at the project and sign up if you are interested. They will be collecting submissions and contacting us. And thank you to the folks at the SERCC who were at the event and presenting and answering questions
- Chip Konrad
- Chris Fuhrmann
- William Schmitz
- Liv Davis
- Lauren Babinetz
- Andrew Robinson