
To avoid doomscrolling for the next four years, I picked up a new hobby this weekend: reviewing provisional voting data from the recent election.

What is provisional voting?
I’ve never voted using a provisional ballot. I sort of knew it was a thing, but also sort of didn’t care that it was a thing. Then someone told me Allison Riggs’ race could come down to the counting of provisional ballots.
Then I cared. Deeply.
Voters get a provisional ballot when, according to the North Carolina State Board of Elections (NCSBE), questions arise about a voter’s qualification to vote or their eligibility to vote in a given election or to “vote a specific ballot style.” They also get a provisional ballot when they don’t show a valid photo ID.
The basic order of operations is 1) you show up all jazzed to vote 2) something goes wrong 3) you fill out a provisional ballot in hopes that they will deem you eligible to have your vote counted 4) the county board of elections researches your eligibility. Per the NCSBE, “county board of elections members make final determinations about voter eligibility.”
That all sounds fairly reasonable when you ignore that boards of elections comprise regular folks in each NC county and about half the country is in a cult and we’ve recently been through an attempted coup and there have been various plots to restrict or suppress the vote or flat out steal elections and NC Republicans are right now taking away the power of the incoming governor (the one who just soundly beat their candidate, a Nazi) to appoint one member to each board. But I digress.
How many provisional ballots were cast in North Carolina?
In 2024, just over 64,000 people voted provisionally, including more than 58,000 on Election Day.
In 2020, it was close to 41,000.
(Data note: the number of provisional voters in any analysis/maps below is based on data as of Nov. 5 and downloaded Nov. 14 from NCSBE. That file includes about 800 more provisional voters than the 64k figure linked above. I have not attempted to reconcile the difference.)
Why the jump?
It’s hard to say without the sort of analysis that would require the Blog Blog to pay me more than my current salary of $0. Perhaps there are more provisionals because we live in a growing state with lots of new voters. Perhaps Hurricane Helene impacted a large number of voters. Perhaps the voter ID law, which went effect in 2023, explains the change.
Whatever it was, it mattered.
In 2020, 0.74 percent of all ballots cast were provisional ballots. By 2024, that number roughly doubled to 1.42 percent.
That may not seem like a lot. Unless your name is Allison Riggs, who leads by only about 600 votes as I write this.
Who voted provisionally?
Although county boards of election have made decisions on which provisionals ballots to count and which to reject, those data are not yet available to analyze. We do have data on those who received a provisional ballot. Relative to all voters registered as of Nov. 5, 2024, both Democrats and Republicans are overrepresented among provisional voters, while Unaffiliated voters are underrepresented. Not going to lie, I was a little surprised to similar shares of Democrats and Republicans had their votes ensnared in provisional purgatory. Feeling pretty good about the Old North State!
| Party | Count of provisional votes | Share of provisional voters | Share of all 2024 registered voters |
|---|---|---|---|
| Democrat | 22,014 | 33.8% | 32% |
| Unaffiliated | 20,802 | 31.9% | 38% |
| Republican | 20,746 | 31.9% | 30% |
Until now. Black voters are overrepresented among provisional voters relative to their share of all registered voters, while white voters are underrepresented. This is what Republicans were hoping to see when they enacted the voter ID law (lol at the idea that they actually care about protecting the vote from migrant caravans or whatever nonsense they spout).
| Race | Count of provisional votes ‡ | Share of provisional voters ‡ | Share of all 2024 registered voters |
|---|---|---|---|
| White | 21,454 | 50.3% | 63.7% |
| Black | 13,928 | 32.6% | 19.7% |
‡ Race is indicated in NCSBE data for a portion of provisional voters
Why did people vote provisionally?
When someone casts a provisional ballot, the county in which they attempted to vote categorizes their reason for receiving a provisional ballot and provides that data to NCSBE. There are 10 official reasons for voting provisionally (definitions here).
| Reason voted provisional | Count of reason voted provisional | Share of all 2024 provisional voters |
|---|---|---|
| NO RECORD OF REGISTRATION | 38,340 | 58.9% |
| INCORRECT PRECINCT | 6,219 | 9.6% |
| PREVIOUSLY REMOVED | 5,694 | 8.7% |
| UNREPORTED MOVE | 5,031 | 7.7% |
| ID NOT PROVIDED – EXCEPTION -REASONABLE IMPEDIMENT | 4,402 | 6.8% |
| ID NOT PROVIDED – NO EXCEPTION FORM/ RETURN WITH ID | 2,231 | 3.4% |
| UNRECOGNIZED ADDRESS (GEOCODE ISSUE) | 1,528 | 2.3% |
| JURISDICTION DISPUTE | 662 | 1.0% |
| VOTER ALREADY VOTED | 658 | 1.0% |
| ID NOT PROVIDED – EXCEPTION -NATURAL DISASTER | 285 | 0.4% |
| INCORRECT PARTY | 44 | 0.1% |
| ID NOT PROVIDED – EXCEPTION -RELIGIOUS OBJECTION | 12 | 0.0% |
| VOTED DURING EXTENDED HOURS | 5 | 0.0% |
| ID NOT PROVIDED | 5 | 0.0% |
| Grand Total | 65,116 | – |
Far and away the largest reason people voted provisionally was due to no record of registration, which NCSBE describes as meaning “a voter’s record of registration cannot be found in the voter registration list at the time the voter presents to vote at the voting place.” I am not quite sure what this means. Simple spot checking using the NCSBE voter lookup indicates that at least some of these voters are registered and have been for years (NCSBE includes the name and addresses of provisional voters in the dataset I used for this post). Perhaps they mean not in the registration list for that precinct, but then it’s not clear to me why they would not be categorized as “incorrect precinct.”
Fewer than 300 voters didn’t have ID to vote because of Hurricane Helene. These voters had several options to still be able to vote.
About 4,400 voters didn’t bring an ID to vote but were flagged as having a reasonable reason, like a lost or stolen ID, a disability, or having applied for but not yet received an ID. These voters may ultimately be deemed eligible to vote and have their vote counted. About 2,200 voters simply didn’t bring an ID and didn’t offer any explanation.
Previously removed voters can include people removed because they haven’t voted in the last two federal elections. Imagine the Laurel and Hardy conversations that must have led to:
Voter: “I’m here to vote.”
Poll worker: “You can’t vote.”
Voter: “Why not?”
Poll worker: “Because you haven’t voted.”
Voter: “That’s right, I’m here to vote.”
You can also receive a provisional ballot if you were removed from the rolls due to your death.

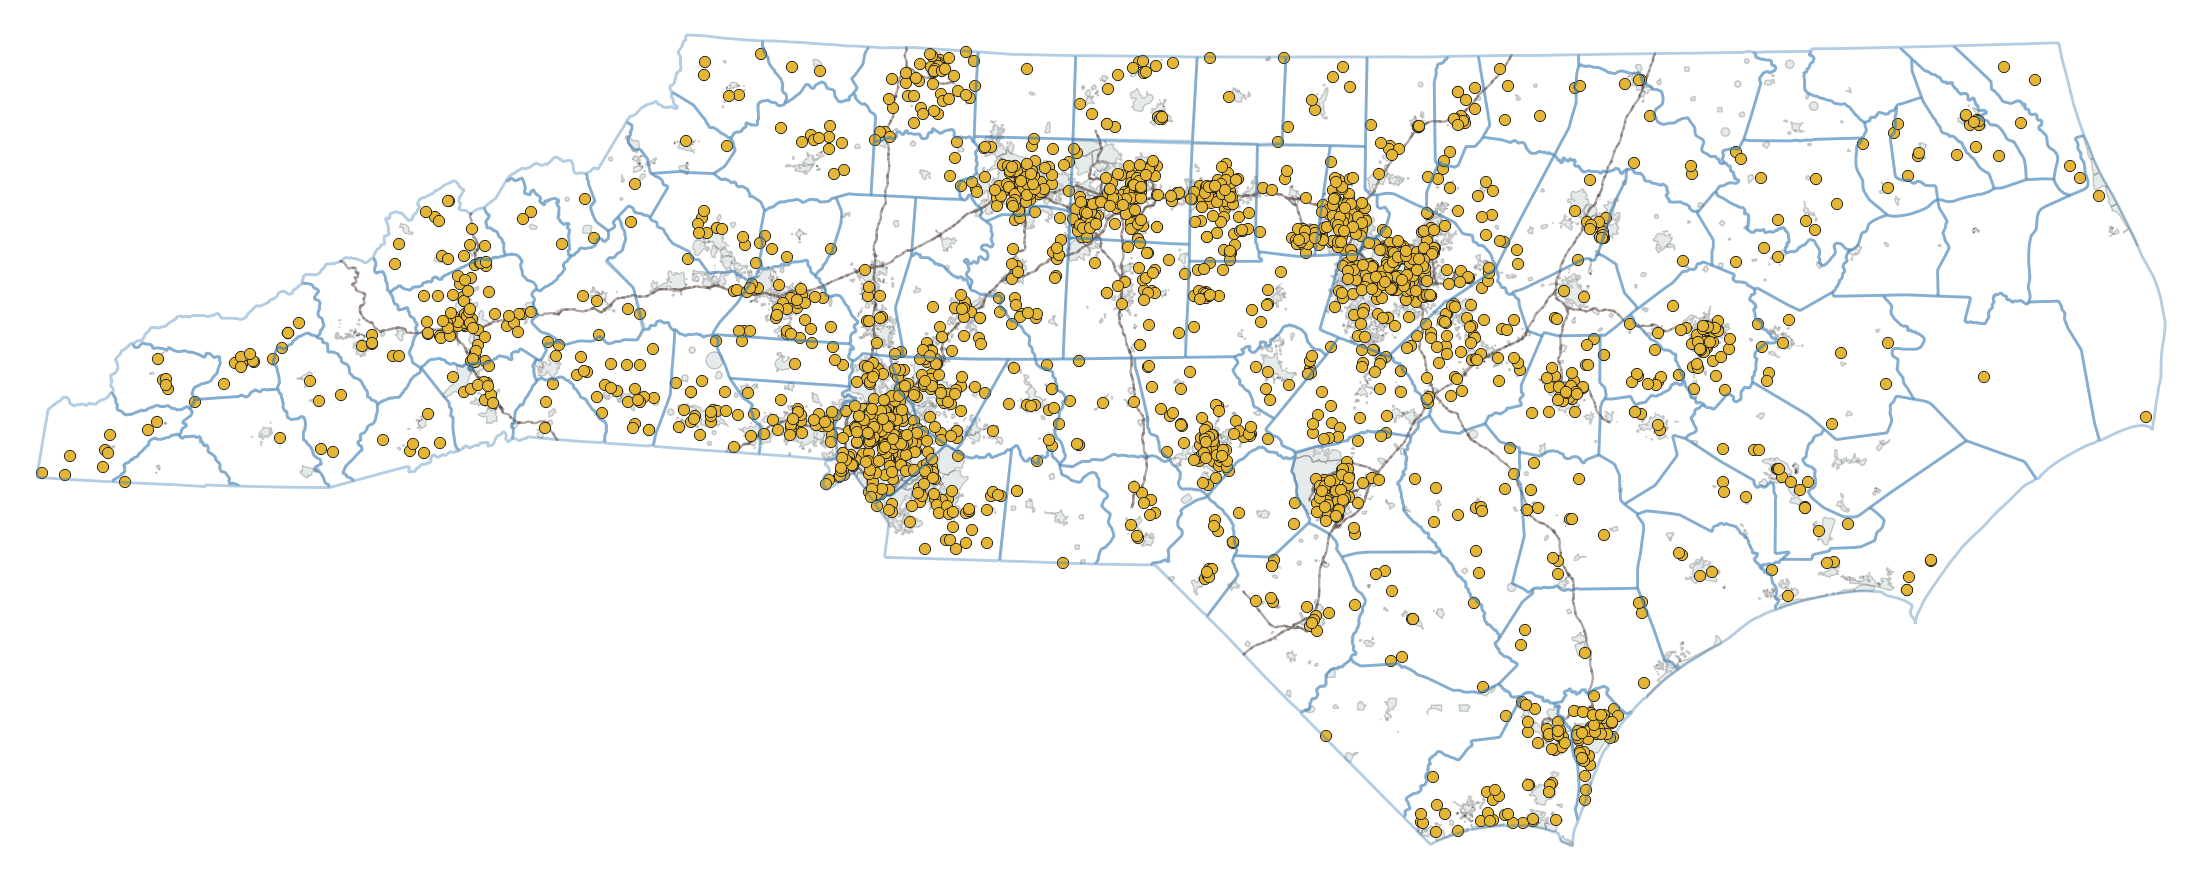
Mostly pointless maps about provisional voting
I thought it might be interesting to see where provisional voters voted. I’m not sure it is, but I made a bunch of maps and I’m not letting them go to waste.
Consider this more of a visual data dump than any real analysis. For the most part, provisional voters live where you might expect—the same places everyone else lives. It would be more useful to drill down and look at precinct-level data, if I had that sort of time or skill, and/or wait until the final data are released to see whose votes ultimately got counted or not. Still, there are a few interesting nuggets in here.
Basic context
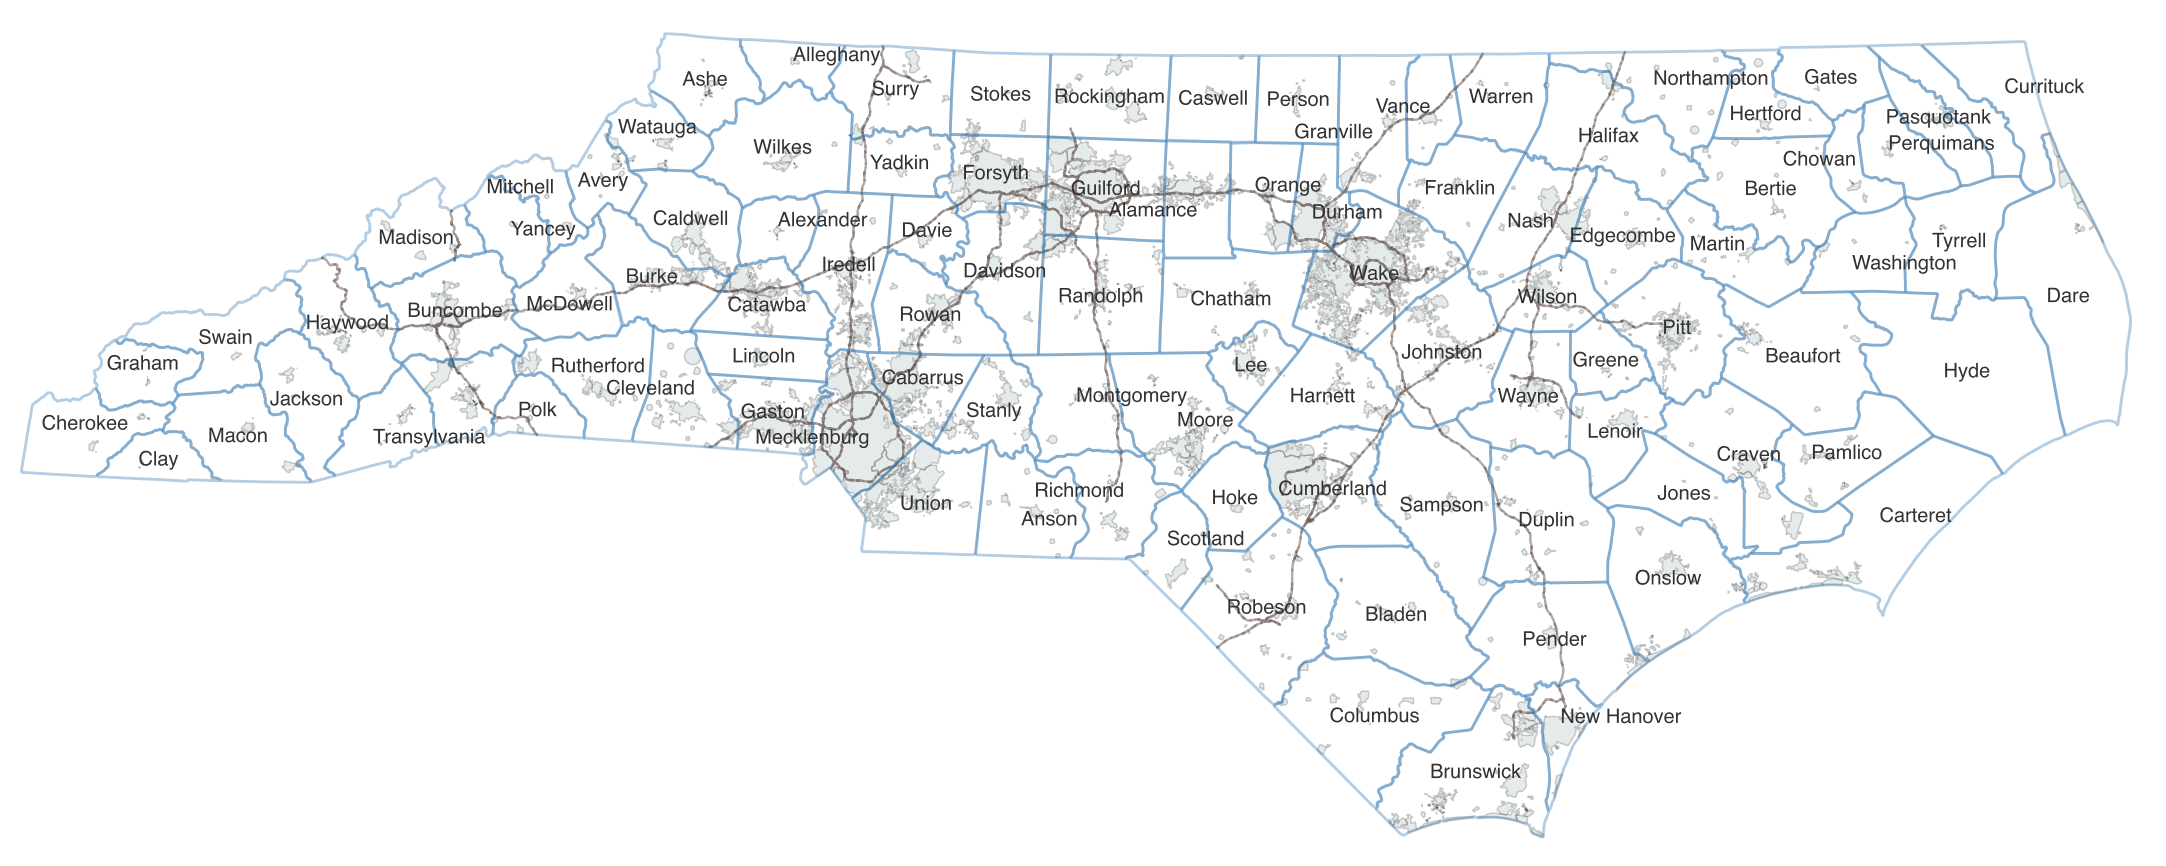
County names, for those of you who didn’t have to memorize them in fourth grade.
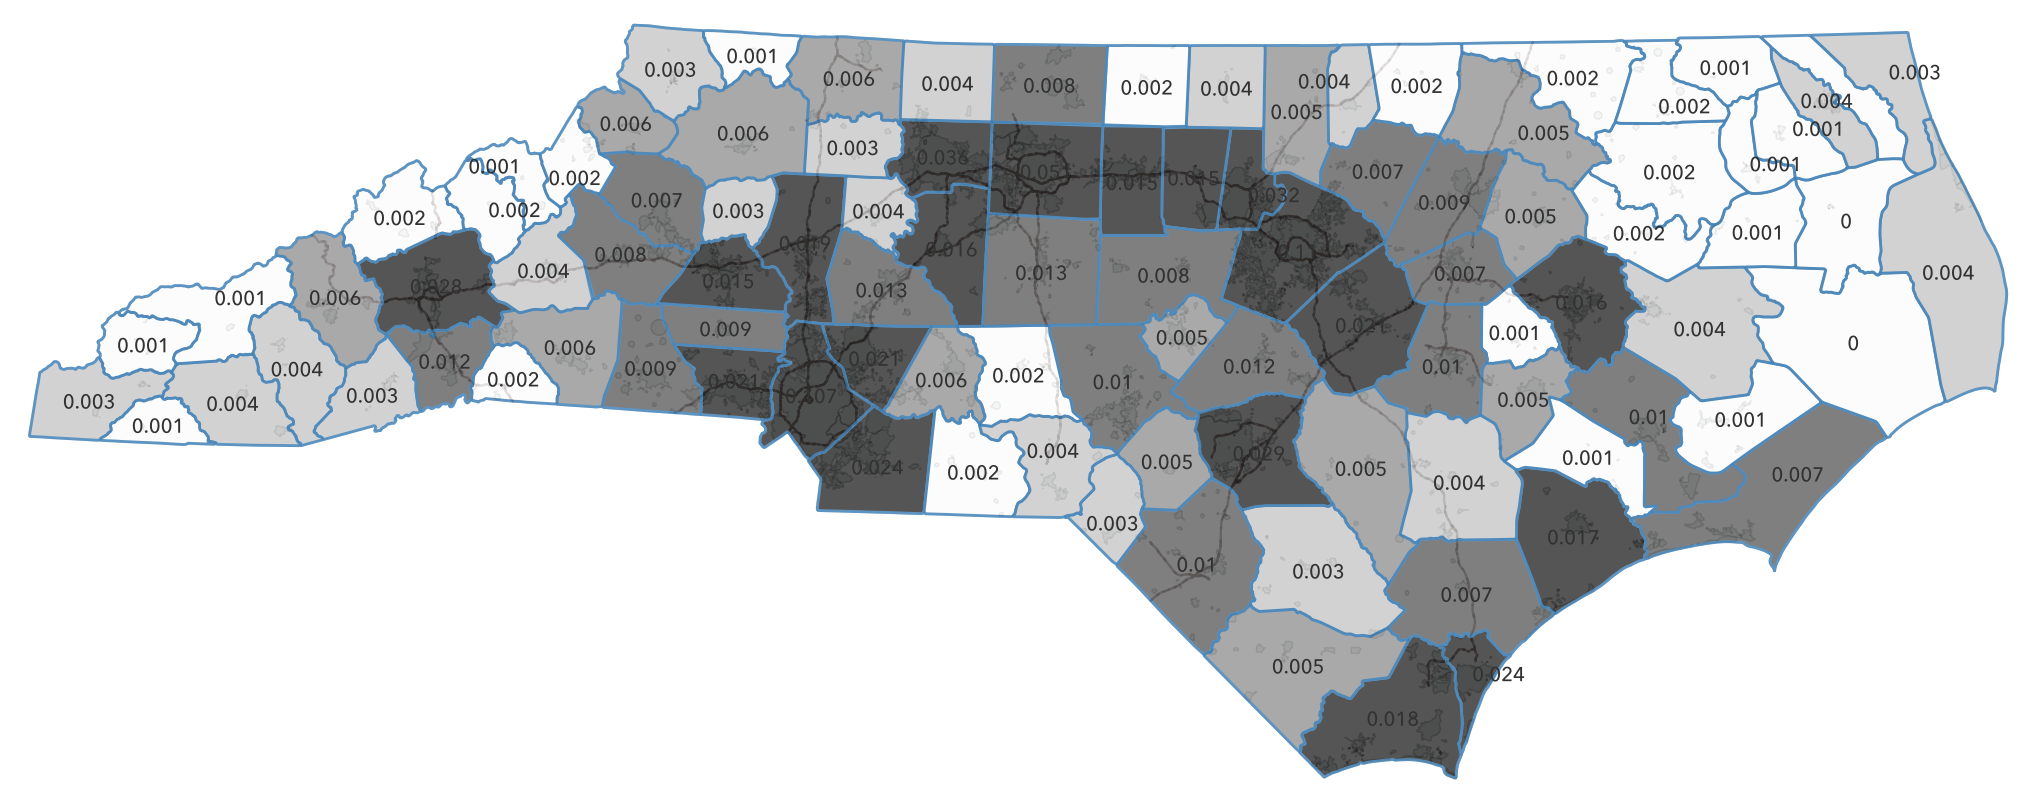
Places with the most registered voters are concentrated in the I-40/85 crescent, Asheville, Fayetteville, and around Wilmington. Values are the share of all NC registered voters by county.
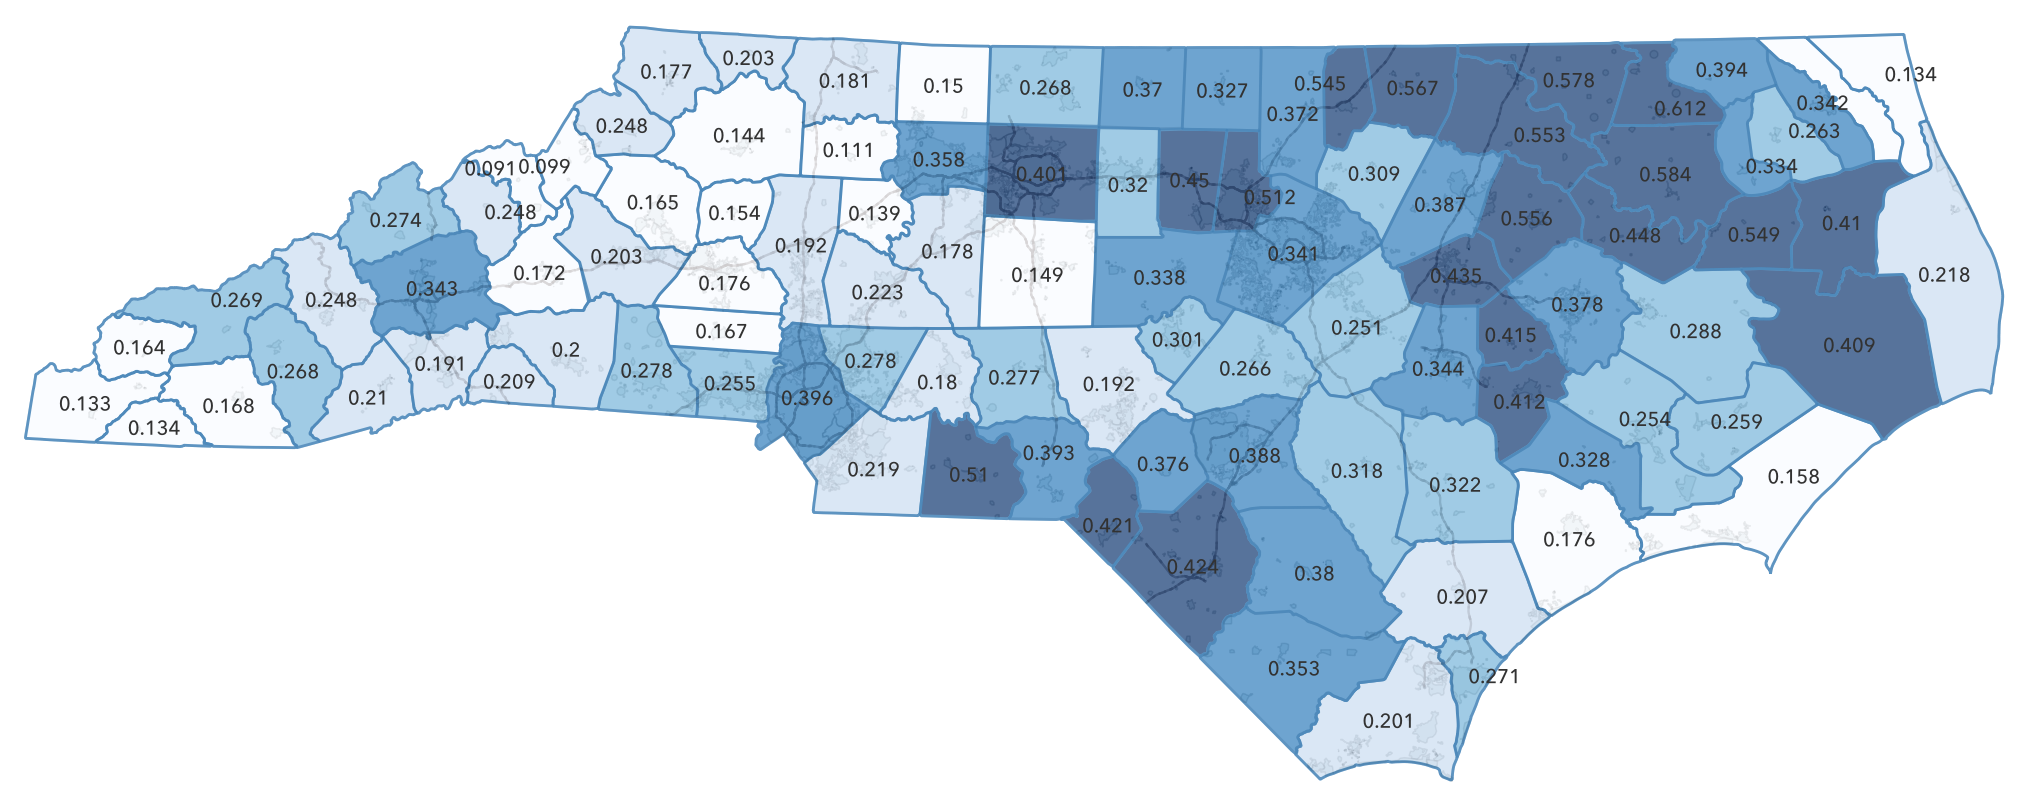
Darker blue counties have higher shares of registered Democrats. Values are the share of each county that is registered D.
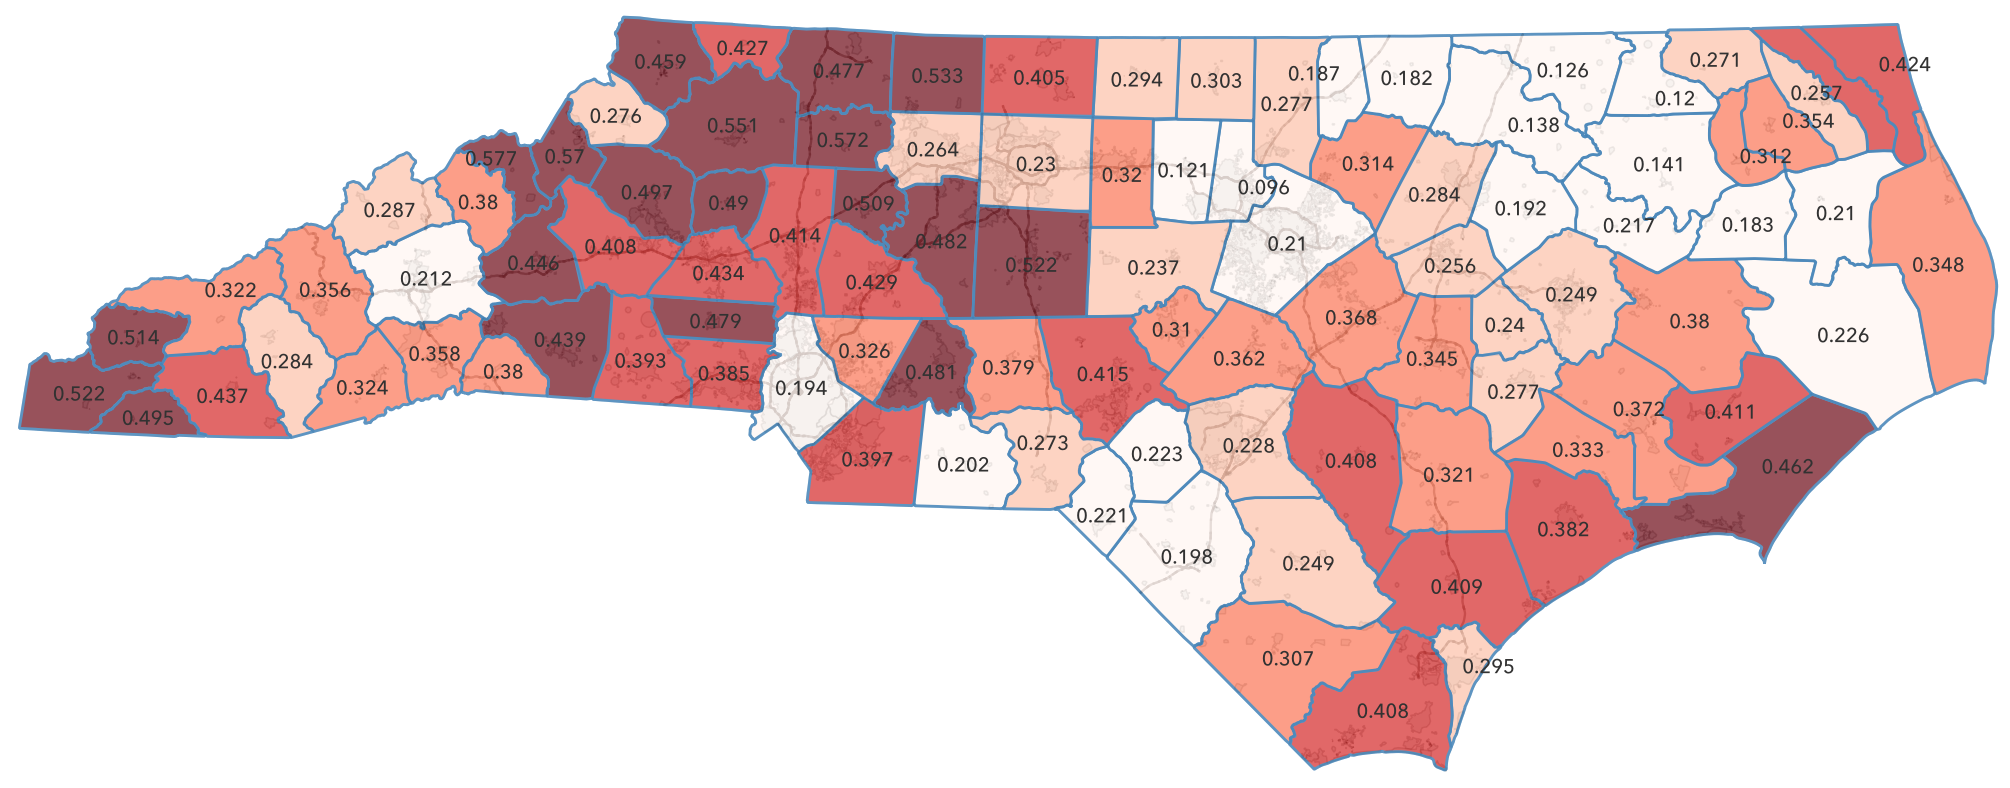
Darker red counties have higher shares of registered Republicans. Values are the share of each county that is registered R.
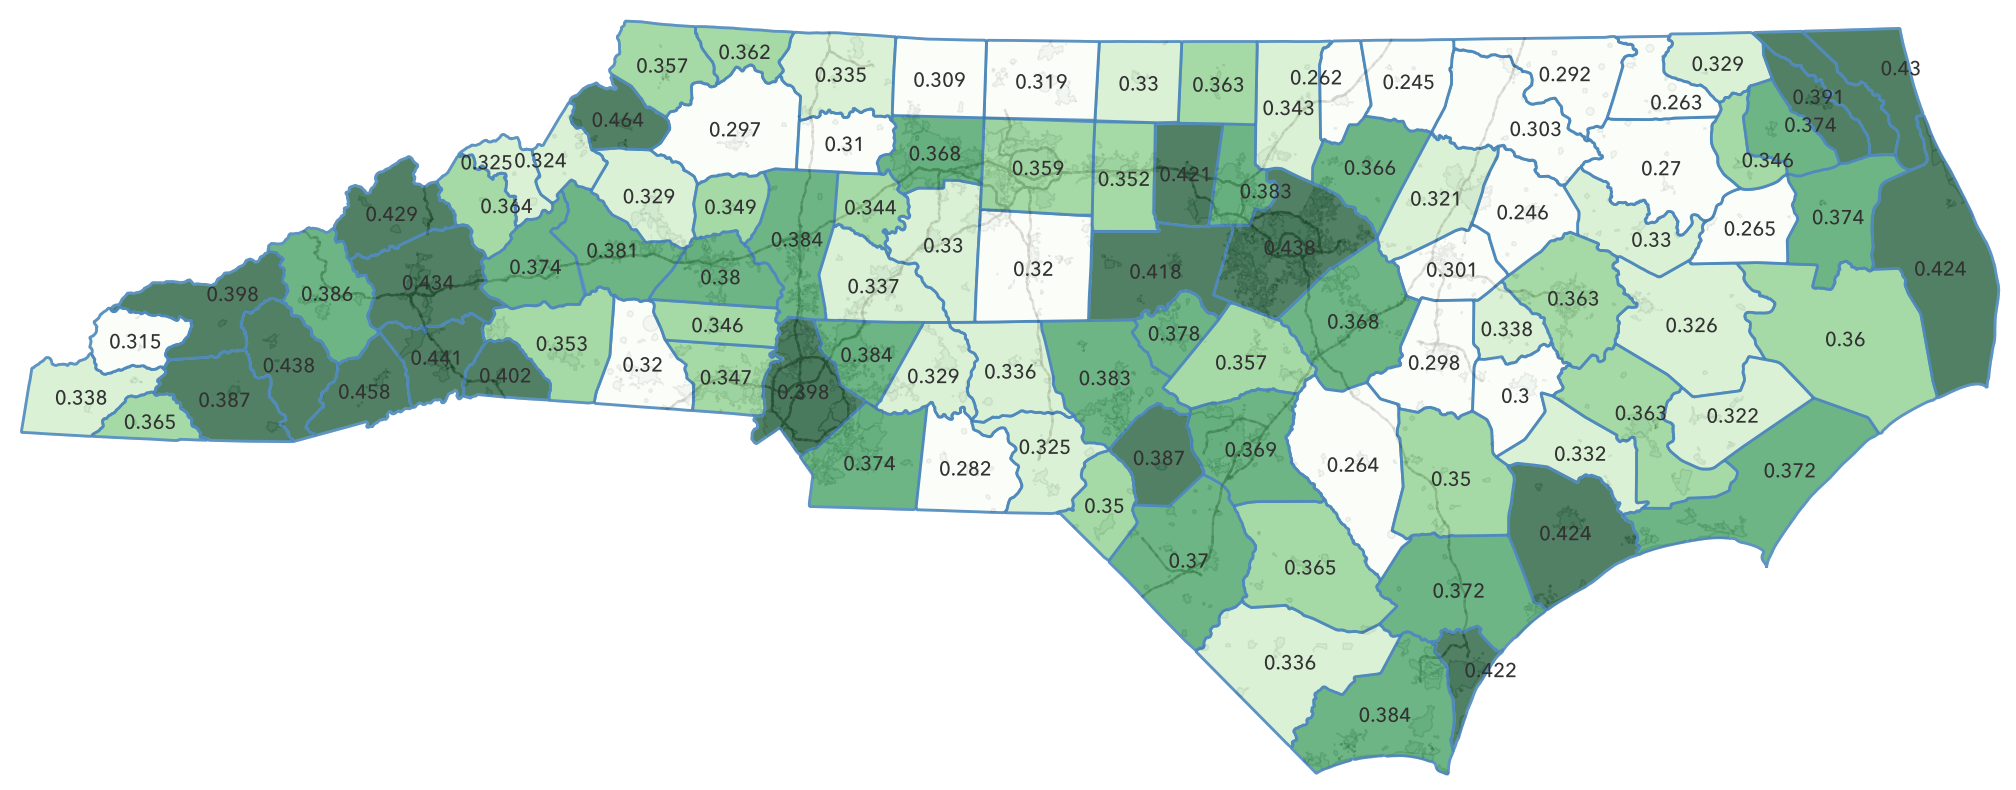
Darker green counties have higher shares of unaffiliated voters. They are all over the place, which makes sense since these are people who can’t really make up their minds. (I’m just kidding—many of them have made up their minds to be Republicans but not tell anyone!) Values are the share of each county that is registered UN.
Helene exceptions
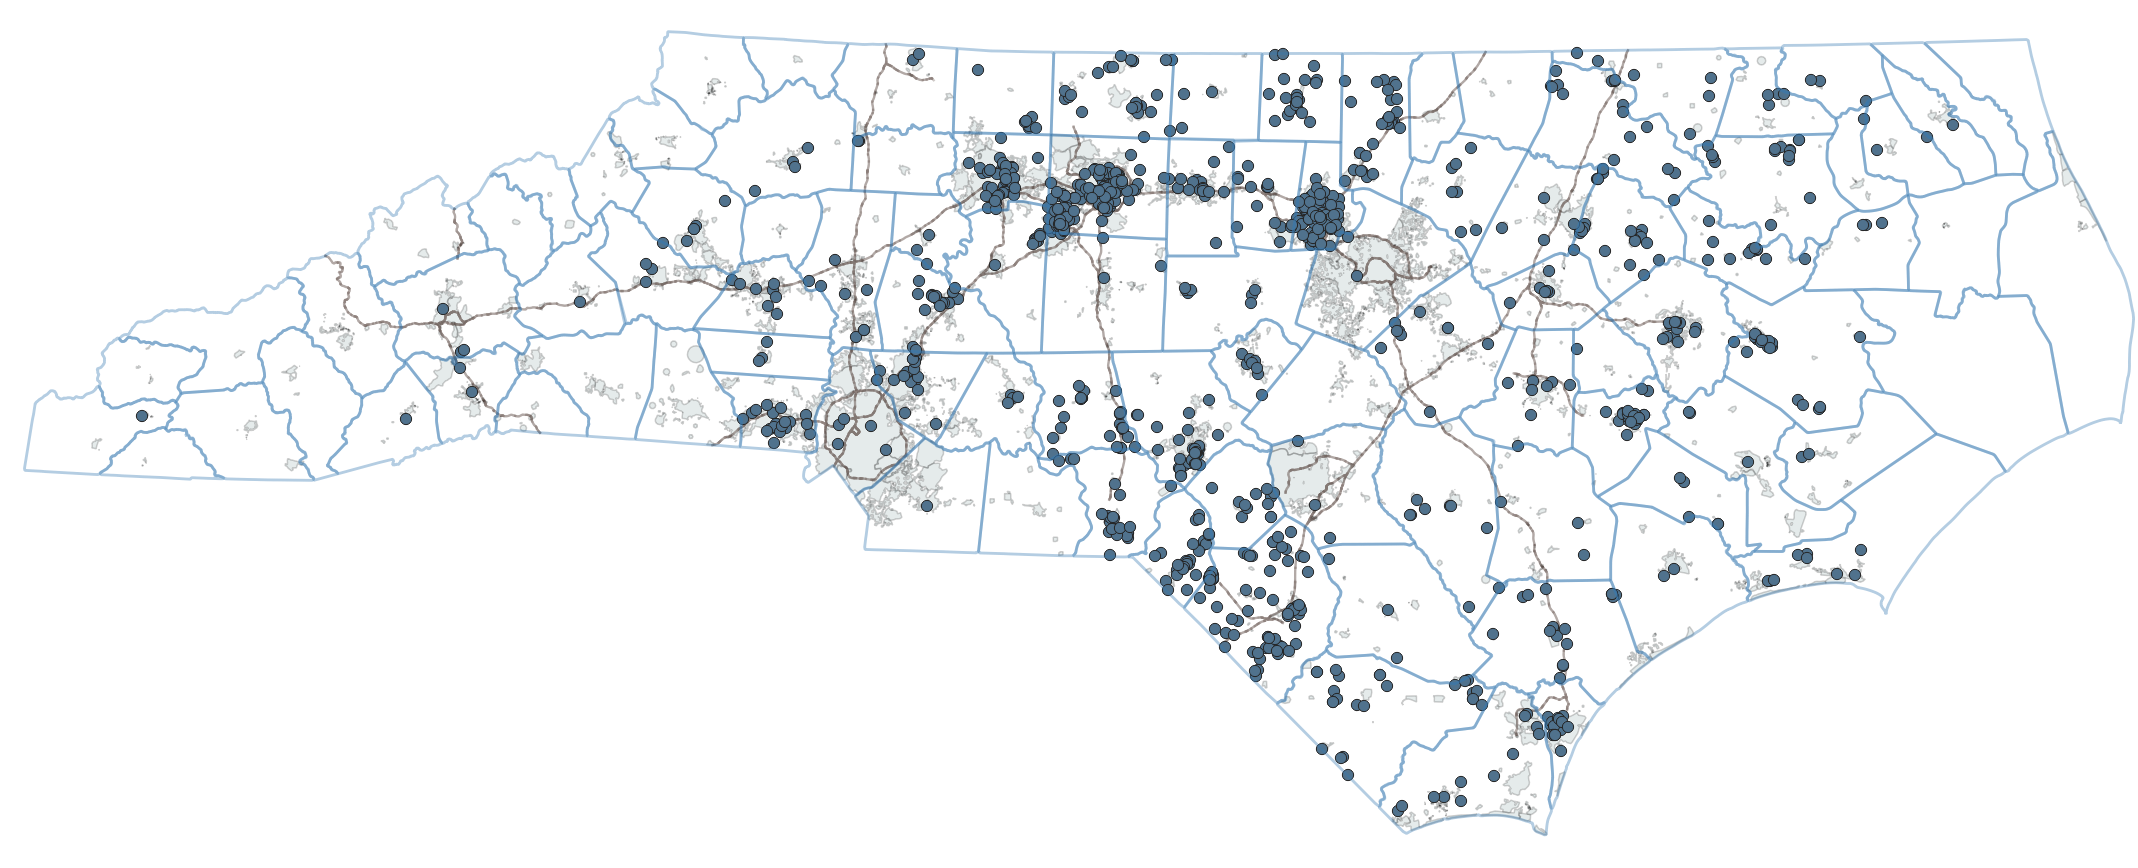
Provisional voters categorized as “no ID – natural disaster exception.” No information is available on voters outside of the 25 mountain counties that had special voting provisions. Refugees?
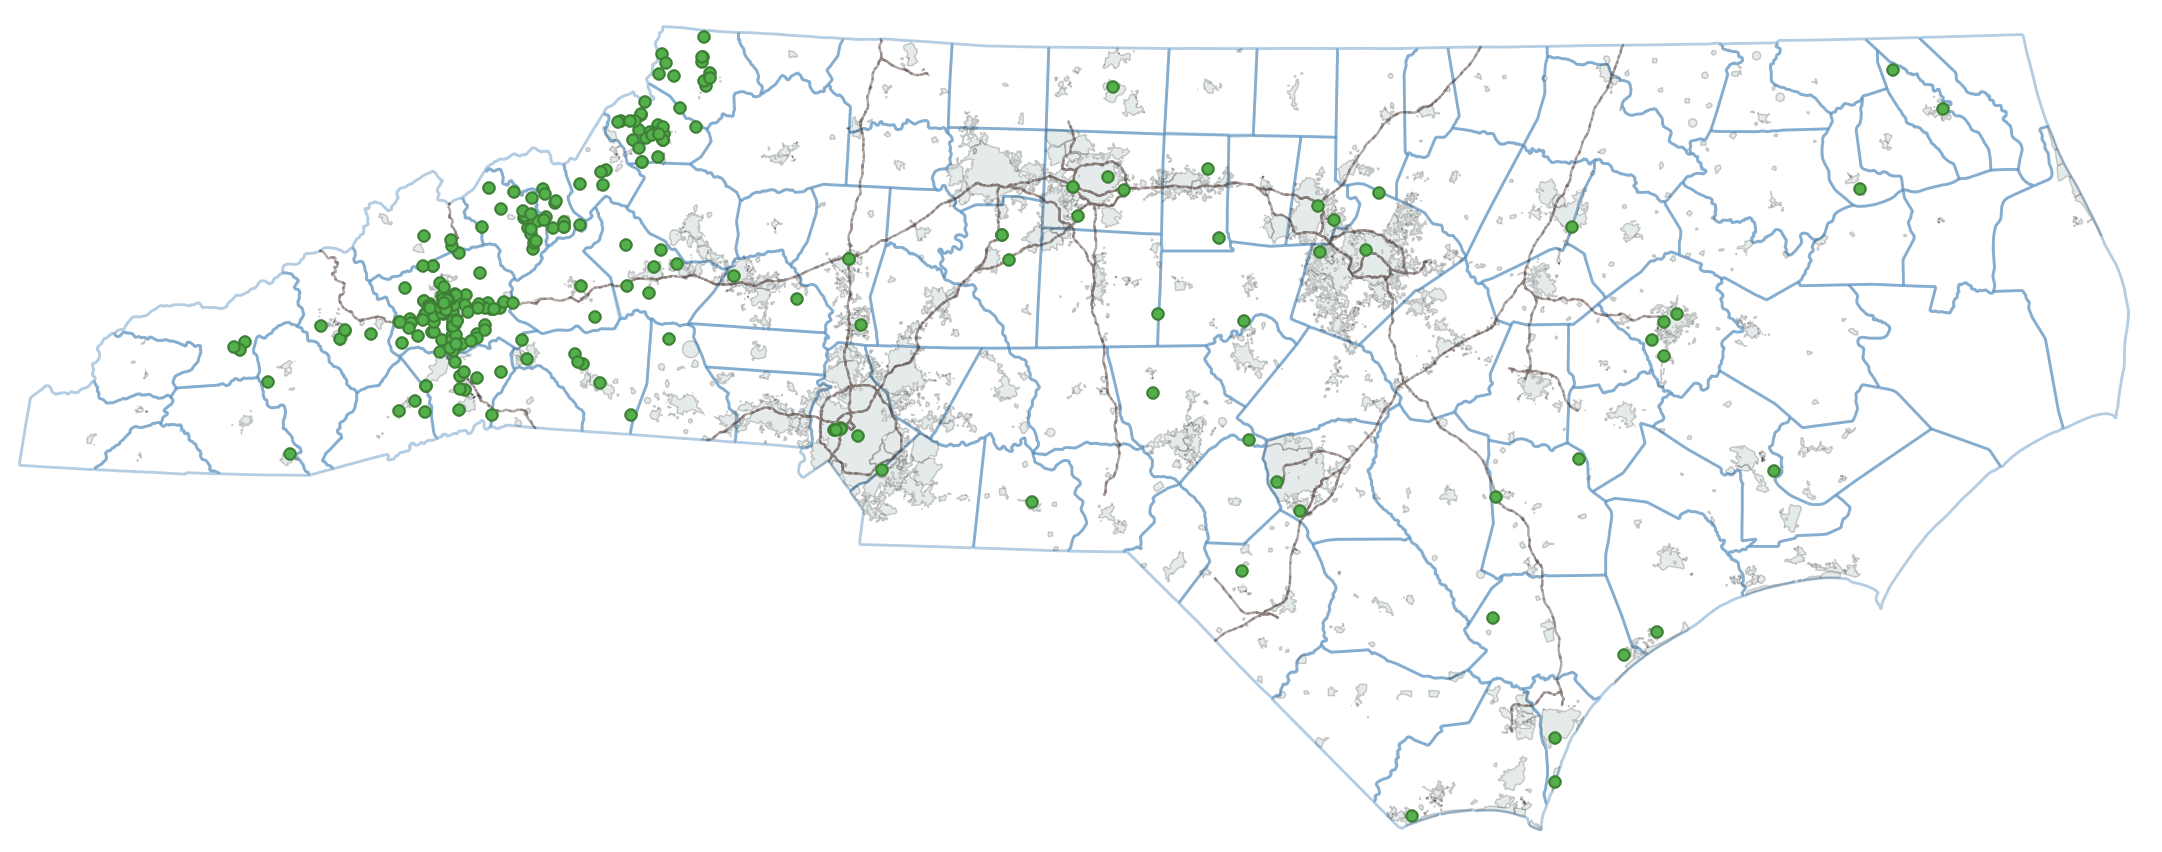
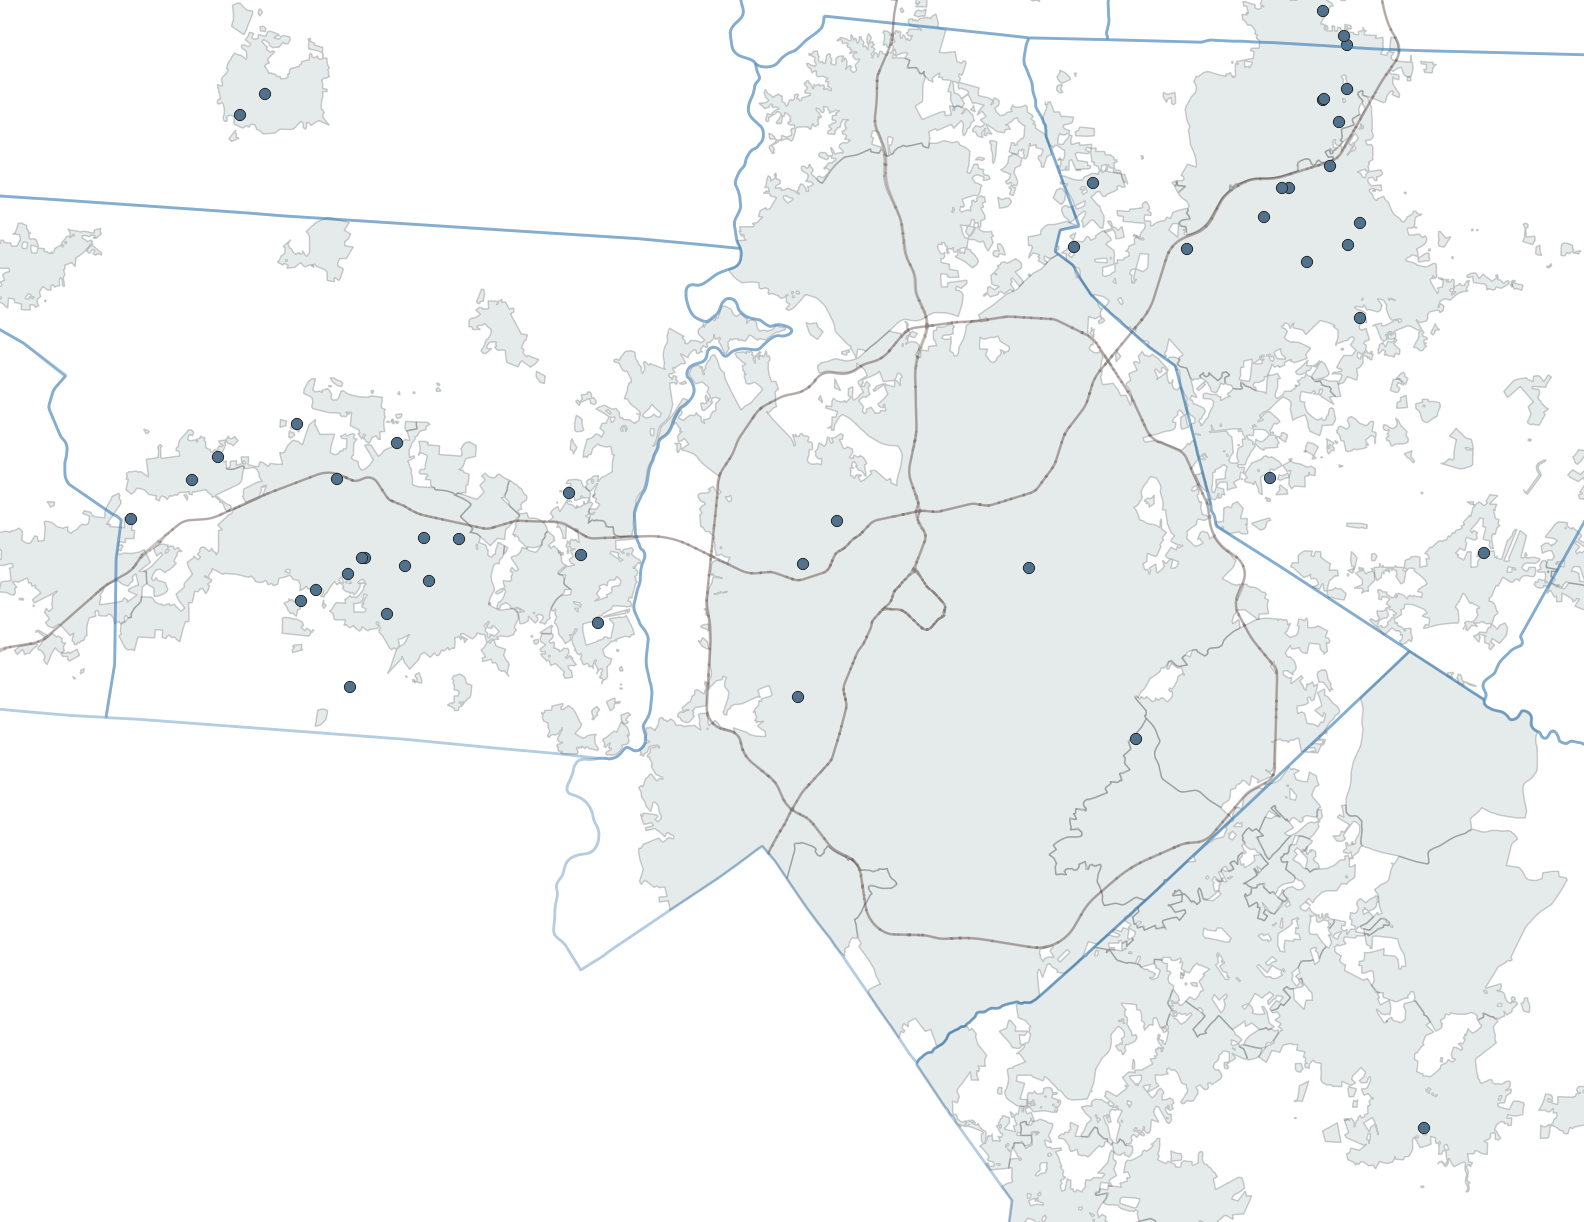
Unreported moves
The biggest concentration of dots here is Cumberland County, near Fort Bragg. It’s not surprising that you’d see a lot of moves here. But what’s the deal with Alamance County? Cabarrus? Caldwell? Presumably moves are happening fairly evenly in similar counties — e.g., Alamance probably has a similar share of residents moving in, out, and around as Guilford. How are county boards apparently interpreting/classifying voters so differently?
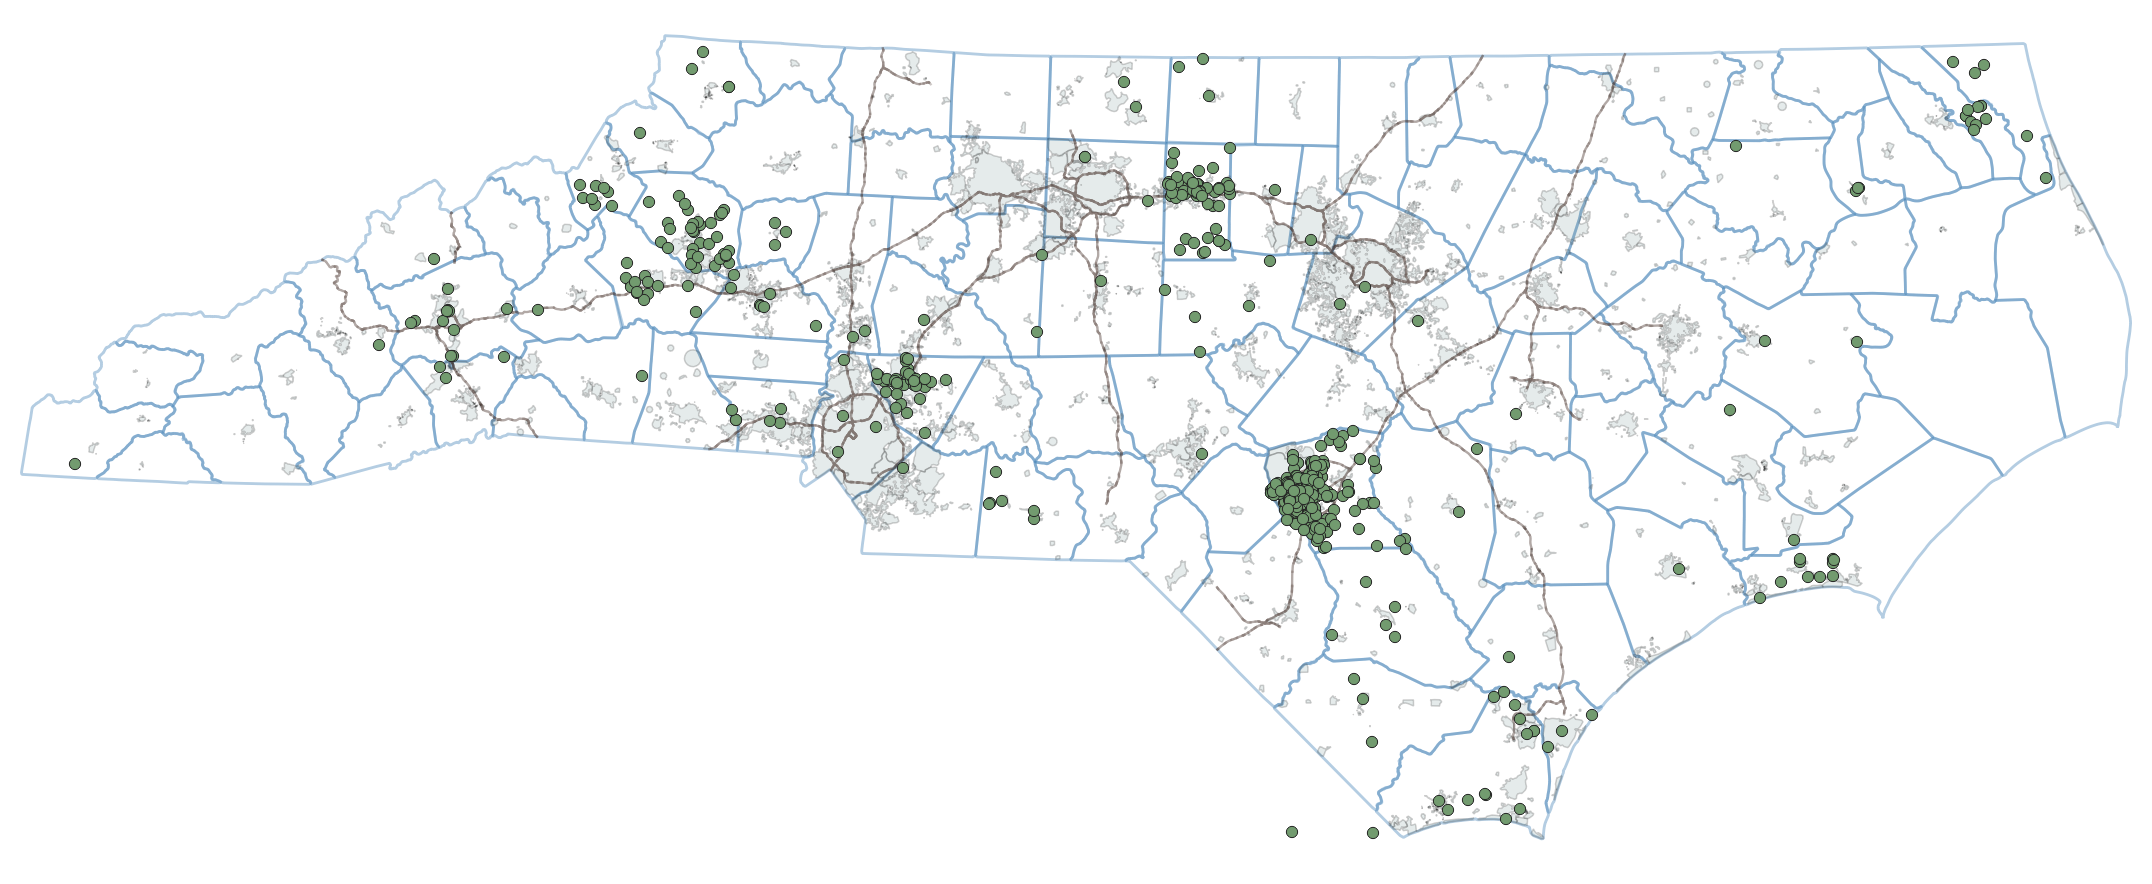
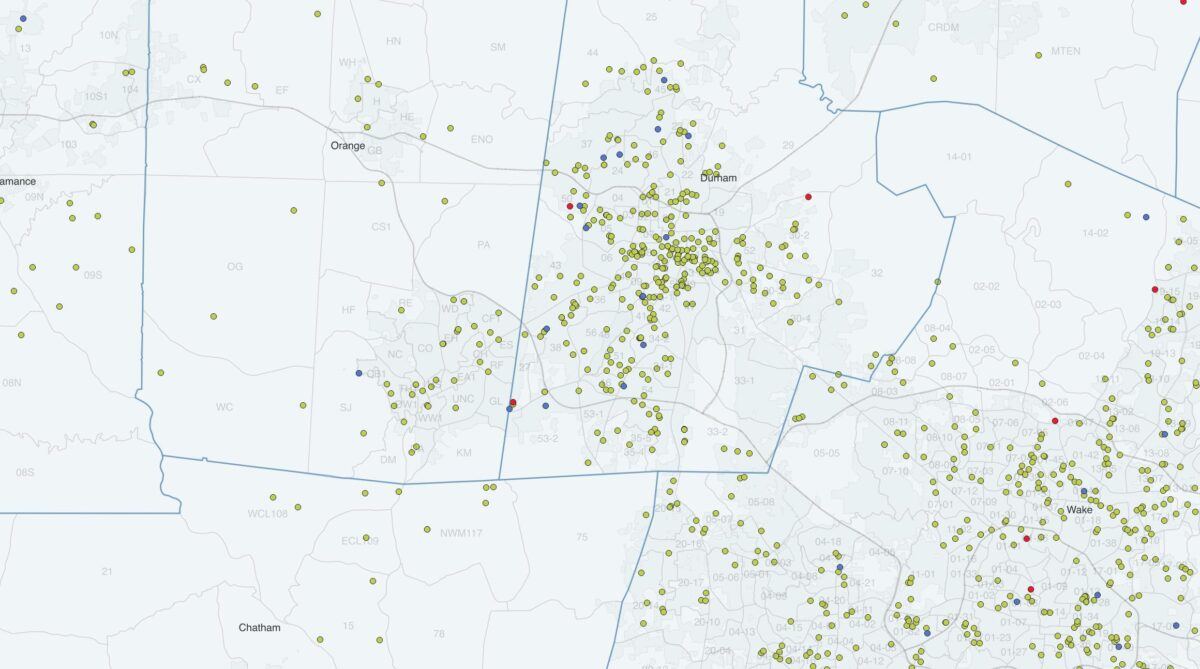
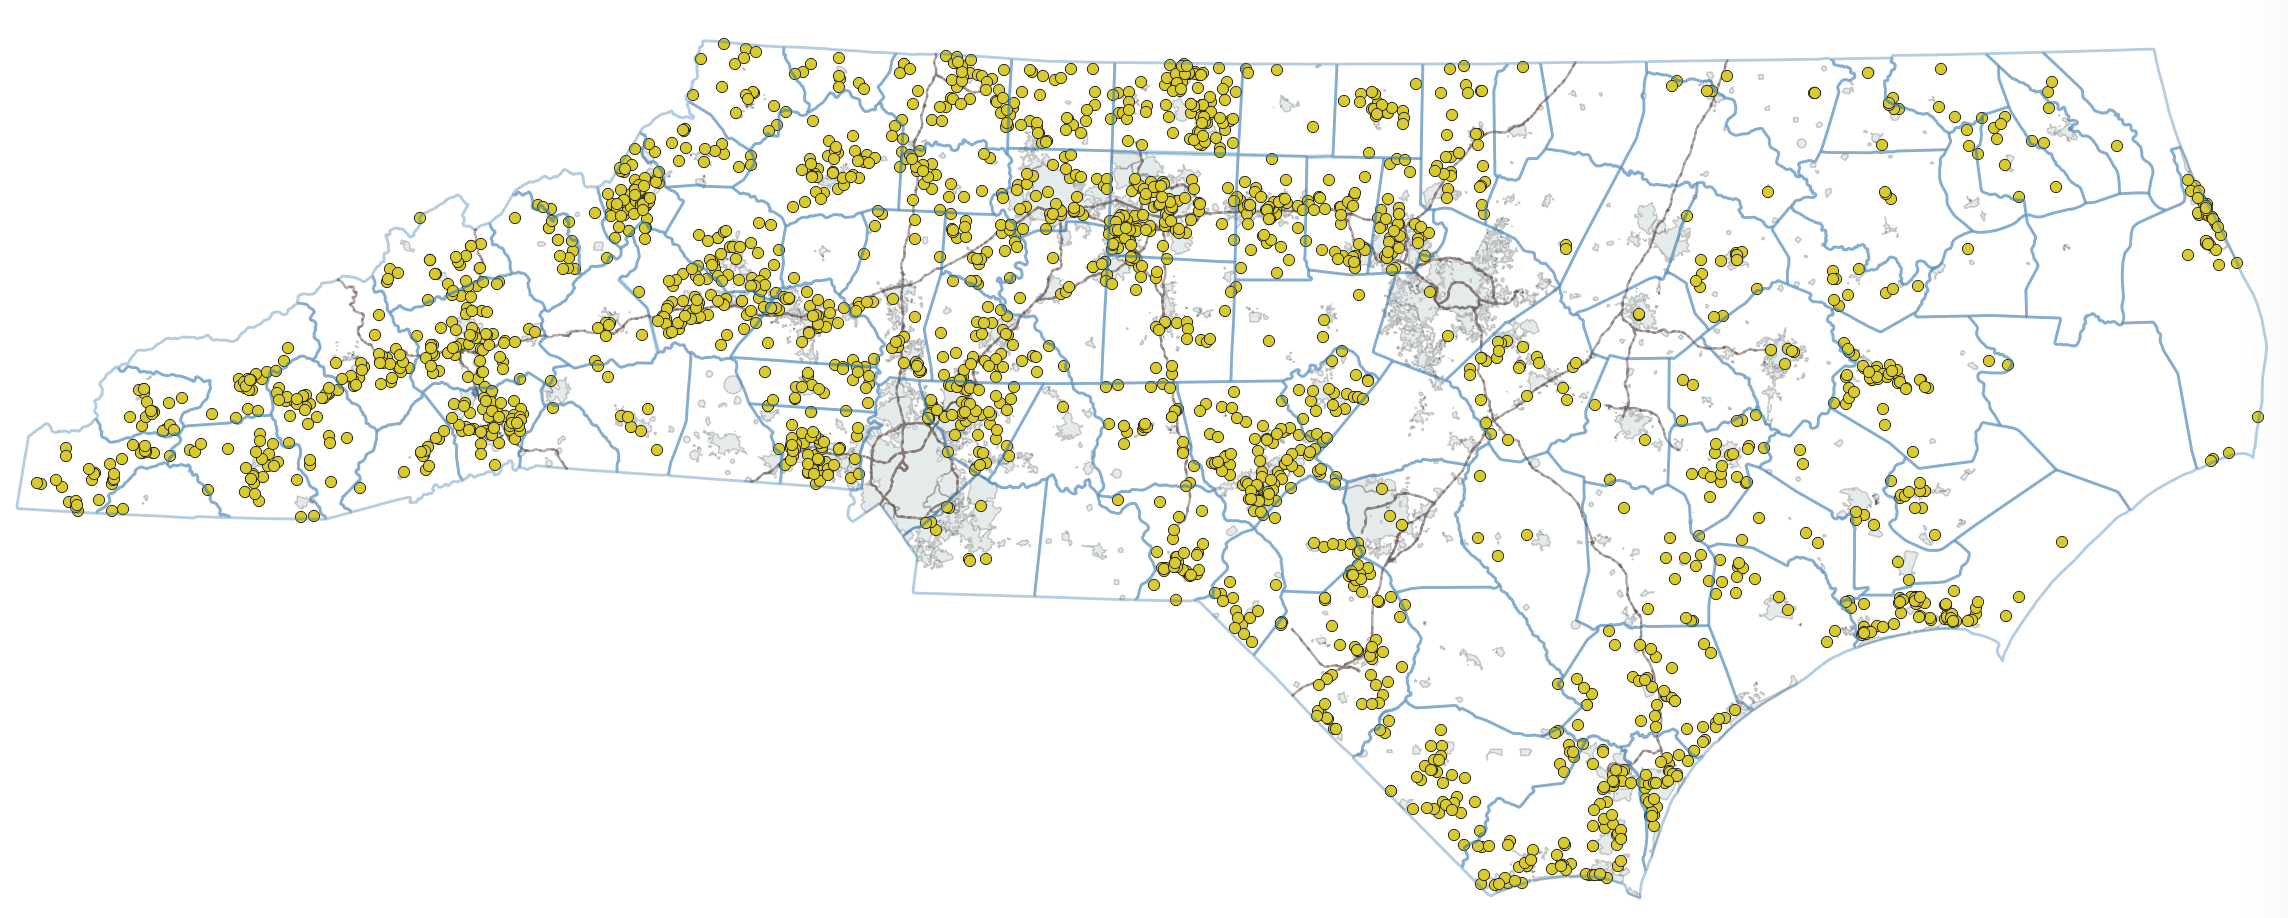
Previously removed voters
Another interesting one. The first map is previously removed Black voters. It’s not that odd to see concentrations in places like Durham, High Point, and Winston, given the large Black populations there.
But how do you get this sort of pattern in and around Charlotte? It’s not only odd because Gaston and Cabarrus have more previously removed Black voters than much larger Mecklenburg, but because Union – birthplace of Jesse Helms – didn’t have removal rates similar to the other outlying counties.
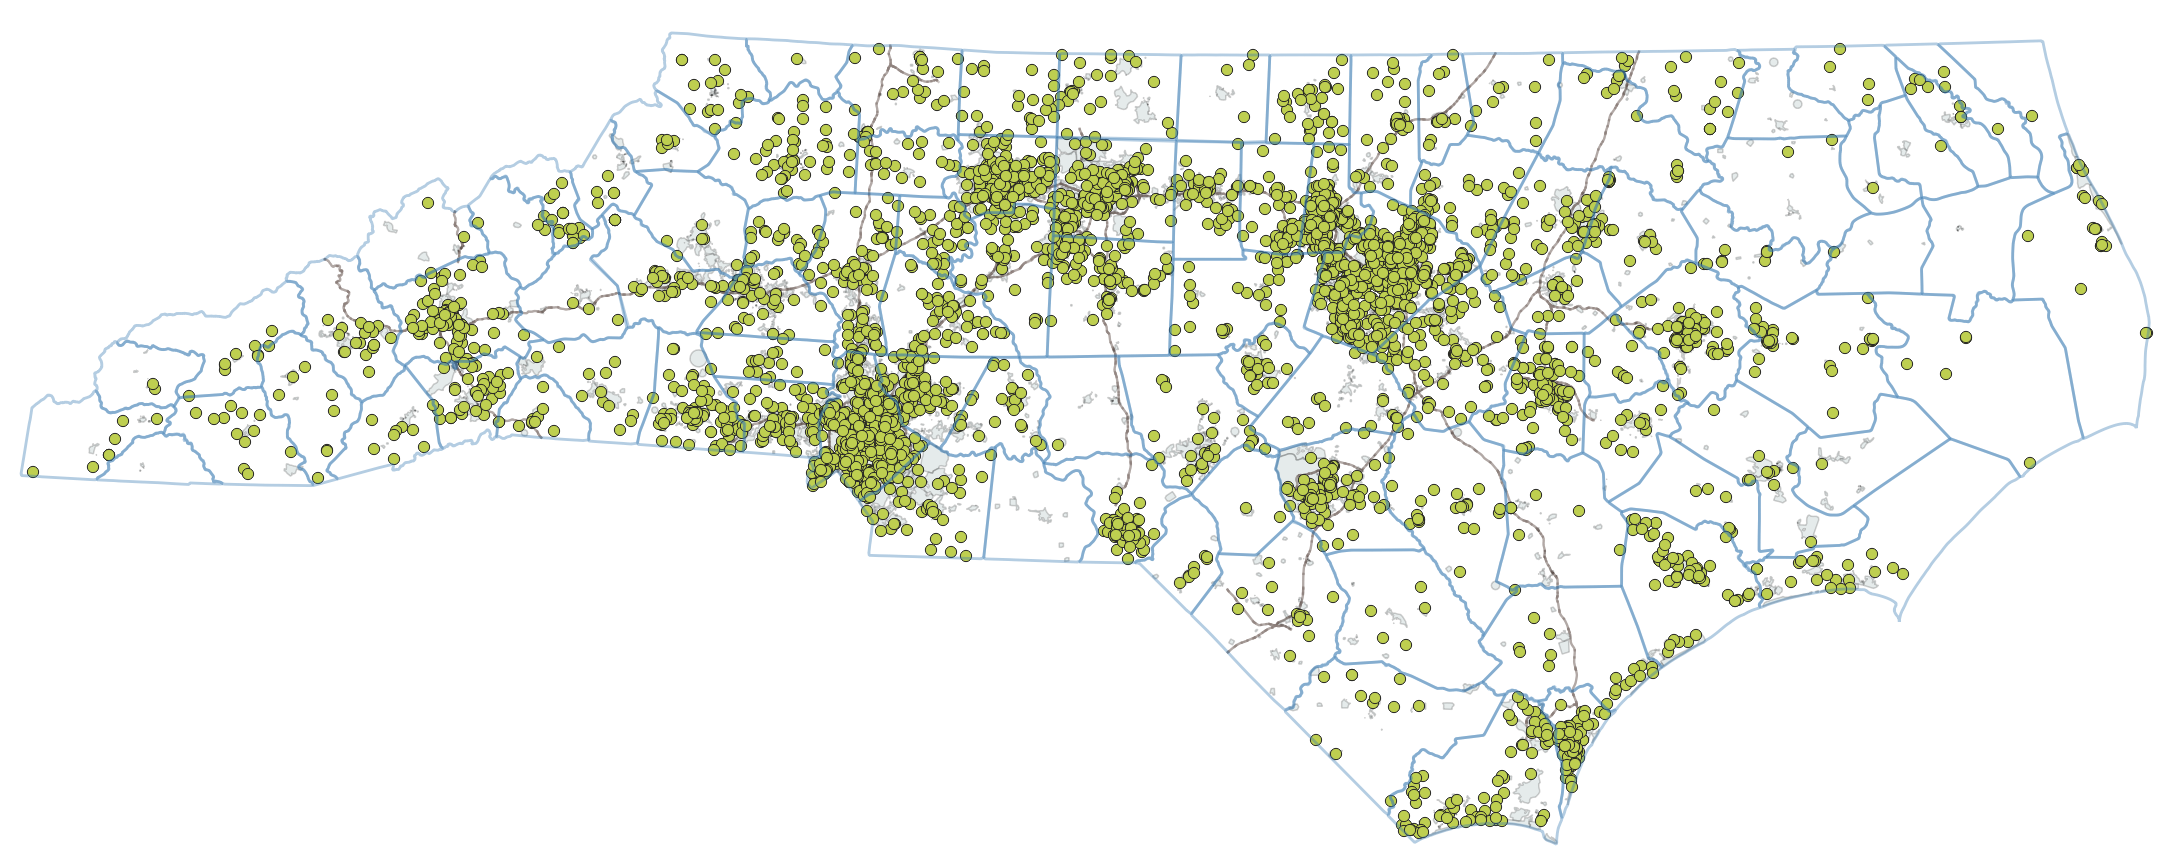
Looking at previously removed white voters shows similar patterns. Do some county boards simply take a more aggressive approach to finding and removing ineligible voters?
Here are your top 10 counties in terms of number of voters who voted provisionally due to be previously removed from the rolls. We see some real power users emerge, with Robeson and Moore punching above their weight. Mecklenburg (not shown) by contrast, is second in the state in terms of the number of registered voters but 82nd in terms of previous voters removed (Wake, for whatever reason, did not categorize most removed voters’ race, which is why they are high on the table below but empty on the maps above).
| County | Number of previously removed voters voting provisionally | State ranking, number of registered voters |
|---|---|---|
| 1. GUILFORD | 345 | 3 |
| 2. ROBESON | 344 | 27 |
| 3. WAKE | 327 | 1 |
| 4. DURHAM | 240 | 5 |
| 5. BRUNSWICK | 193 | 14 |
| 6. PITT | 183 | 17 |
| 7. GASTON | 173 | 11 |
| 8. MOORE | 164 | 26 |
| 9. CABARRUS | 131 | 10 |
| 10. BUNCOMBE | 131 | 7 |
Because everything in North Carolina is about race even it’s not, I wondered if any counties were disproportionally removing previous Black voters. Indeed some are. Montgomery County is the worst offender, flagging almost one percent of all its registered Black voters as previously removed versus less than a quarter of one percent of its registered white voters.
Below is a list of the 25 worst offenders in this regard (wtf, Durham, Guilford, and Orange?)
Not shown is Cabarrus, a top 10 remover. To their credit, they remove an equivalent share of Black and white voters.
| County | Share of all white registered voters flagged as previously voted | Share of all Black registered voters flagged as previously voted | Difference (pp) |
|---|---|---|---|
| Montgomery | 0.22% | 0.95% | -0.73% |
| Stokes | 0.11% | 0.72% | -0.61% |
| Moore | 0.13% | 0.55% | -0.42% |
| Haywood | 0.12% | 0.40% | -0.28% |
| Cherokee | 0.16% | 0.40% | -0.24% |
| Carteret | 0.12% | 0.35% | -0.24% |
| Jones | 0.13% | 0.35% | -0.21% |
| Pender | 0.11% | 0.31% | -0.20% |
| Scotland | 0.14% | 0.34% | -0.20% |
| Person | 0.10% | 0.30% | -0.19% |
| Yadkin | 0.10% | 0.27% | -0.17% |
| Granville | 0.13% | 0.30% | -0.17% |
| Beaufort | 0.18% | 0.35% | -0.17% |
| Bertie | 0.06% | 0.23% | -0.16% |
| Henderson | 0.01% | 0.16% | -0.16% |
| Robeson | 0.26% | 0.42% | -0.15% |
| Durham | 0.03% | 0.17% | -0.14% |
| Wilkes | 0.11% | 0.25% | -0.14% |
| Lenoir | 0.10% | 0.24% | -0.13% |
| Caldwell | 0.08% | 0.19% | -0.11% |
| Guilford | 0.05% | 0.14% | -0.10% |
| McDowell | 0.02% | 0.12% | -0.09% |
| Orange | 0.04% | 0.13% | -0.09% |
| Brunswick | 0.06% | 0.15% | -0.09% |
| Chatham | 0.01% | 0.10% | -0.09% |
Voters categorized as No ID – reasonable impediment
Voters categorized as No ID – no reasonable impediment provided
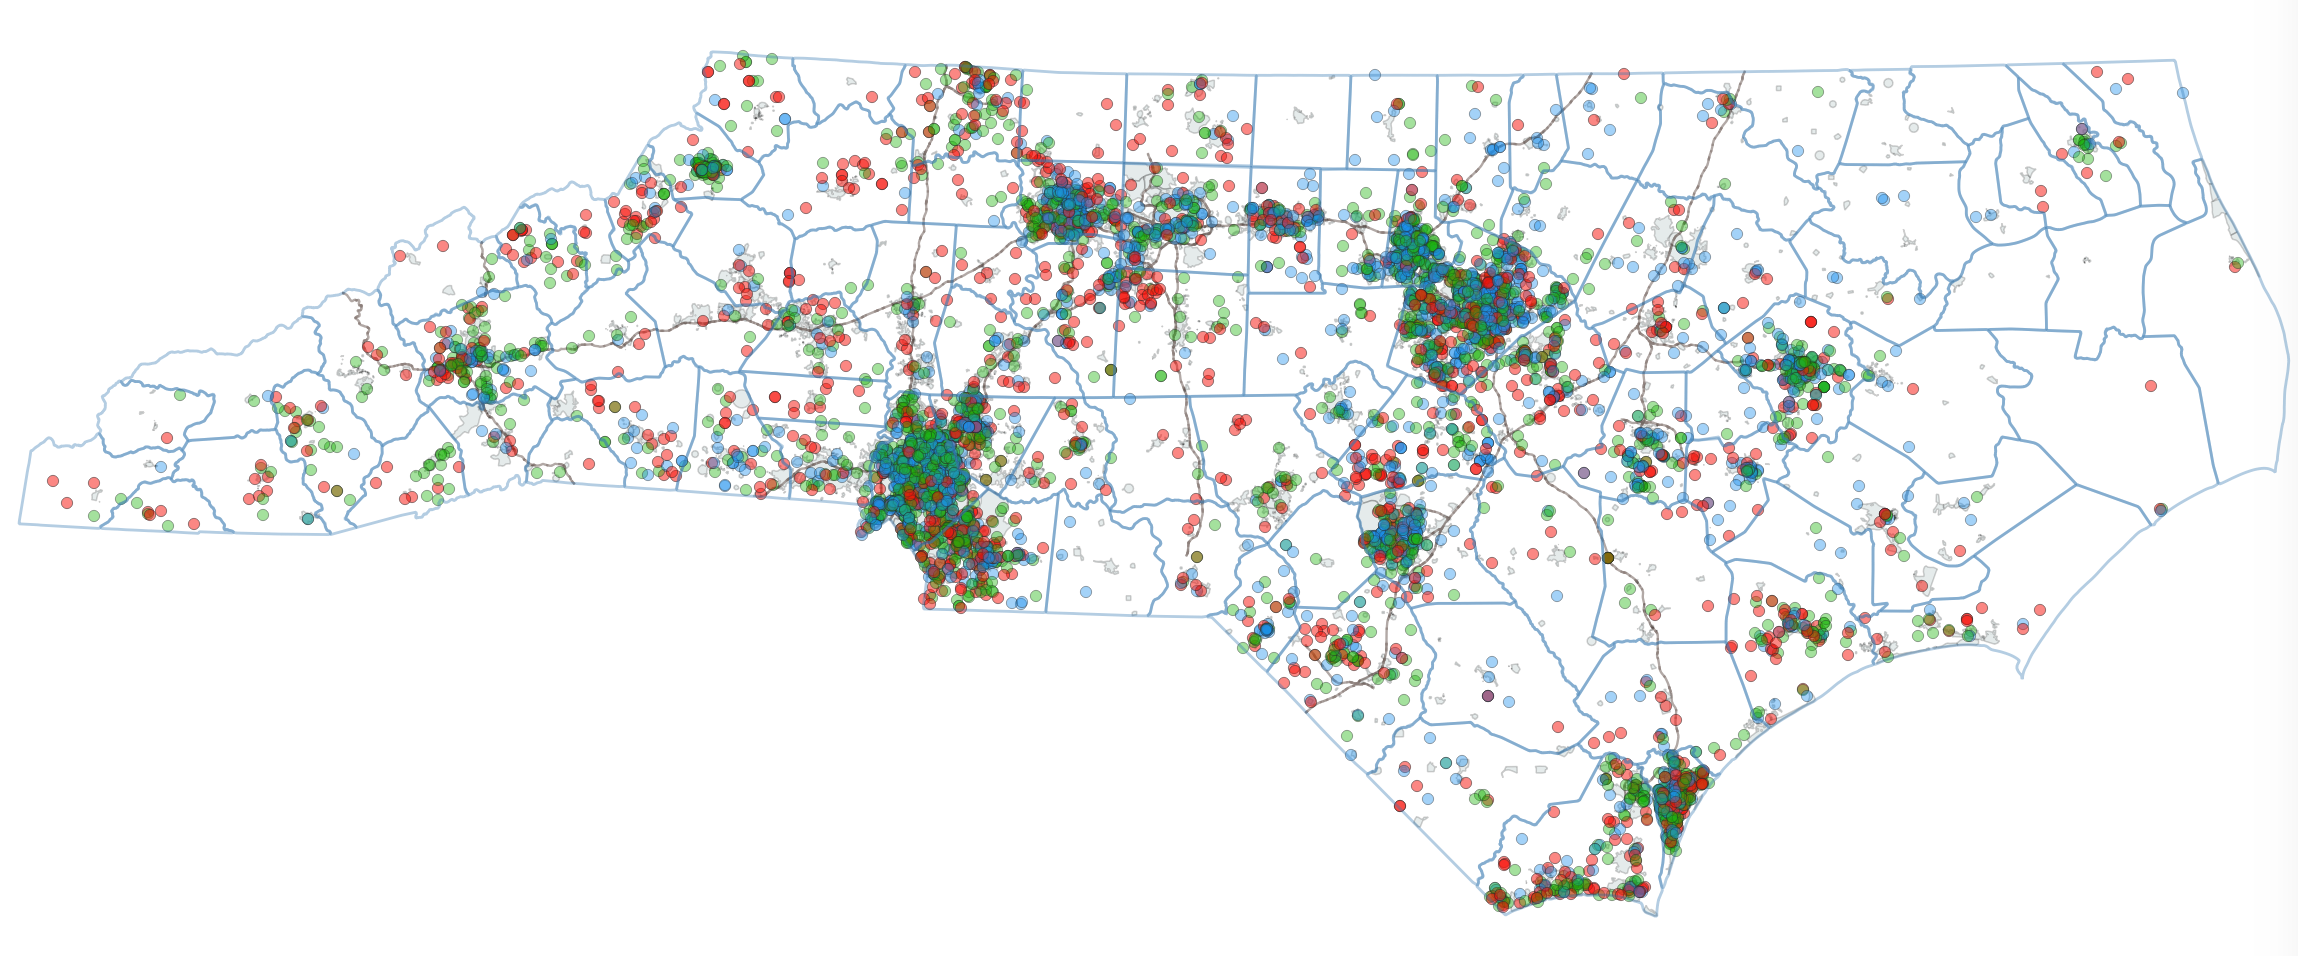
Voters at incorrect precinct
The 6,000+ voters who went to the wrong precinct to vote (Dems in blue, Rep in red, UN in green)
Next steps
Shoot as an email ([email protected]) or find us on Bluesky if you can help make sense of the data above.
There’s tons more analysis that could be done, including looking at which provisional ballots counted vs tossed, and how 2020 provisionals compare to 2024 (pre-post voter ID law). If you are a real data scientist and interesting in helping, please reach out!
Also, sorry the maps are not interactive. We have a whiz working on building a mapping tool for the website that will allow us to do that soon.