
North Carolina State’s Transportation Improvement Program (STIP) is “a 10 year State and Federal-mandated plan that identifies the construction funding for and scheduling of transportation projects throughout the state.”
Last week I received notice that NCDOT was “requesting community input” (actually, a 45 day public comment period is required) on its 10-year STIP via a map/survey.
This is an opportunity for Triangle residents to let NCDOT know which projects they think are important and which are not. I welcome the opportunity to let NCDOT know how I would like my tax dollars used, and maybe you would like to do the same. The public comment period ends July 17, 2024.
NCDOT claims that “Public feedback is crucial to the development of North Carolina’s transportation network,” so let’s give it to them!
To be honest, commenting on the projects is cumbersome, in part because of the huge amount of data that is on the map. This year, it is also harder to look up the projects on the massive spreadsheet that lists all of the projects because the State has removed all of the project numbers from the descriptions on the map, so if you want to look up a project to get more information, you can’t just search for a number on the spreadsheet, you often have to dig through to find it by sorting through counties, types of projects, and then individual projects.
I also found that a few of the projects only show up in certain browsers! For example, the NC 54 West project from the edge of Carrboro to Orange Grove Road, shows the project as a Modernization project on one browser (adding bicycle facilities), but on another it shows it as a Road Widening (adding car lanes). The scoring sheet has both listed, as two separate projects, but the fact that DOT has separated out the bike paths means that they won’t be eligible for the same scoring or funding, AND the fact that “Road Widening” doesn’t show up on some of the browsers means one might not be able to comment on DOT’s plan to widen 54 to 4 or 5 lanes all the way from Carrboro to Graham—at a cost of over $1 billion—to address safety and congestion problems that could be resolved with a combination of improved intersections, better lighting, bypass lanes on hills, and overhead road signs at a much lower cost and with less flood- and heat- inducing pavement.
One other omission from this year’s map is the ability to cumulatively see the cost of the projects you have prioritized. Maybe because on the last go around, some folks pointed out that every bike and ped project in the state could be done for the cost of one over-designed intersection.
You should let NCDOT know where your priorities stand. If enough people comment, maybe we can begin to get projects that communities really want, or at the very least get NCDOT to reconsider some of the over-designed, insanely expensive projects that are only created to move cars, not people, and will do nothing to address road safety and mobility for those traveling by foot, by bike, or by transit.
With this in mind, I offer here a primer for anyone who has time between now and July 17 to let NCDOT know your thoughts on the projects that have been planned for the next 10 years.
NOTE: Due to the amount of data on the survey map, the survey can only be accessed on a desktop computer or tablet.

How to navigate the survey map:
- To get started, open up the survey map on your computer.
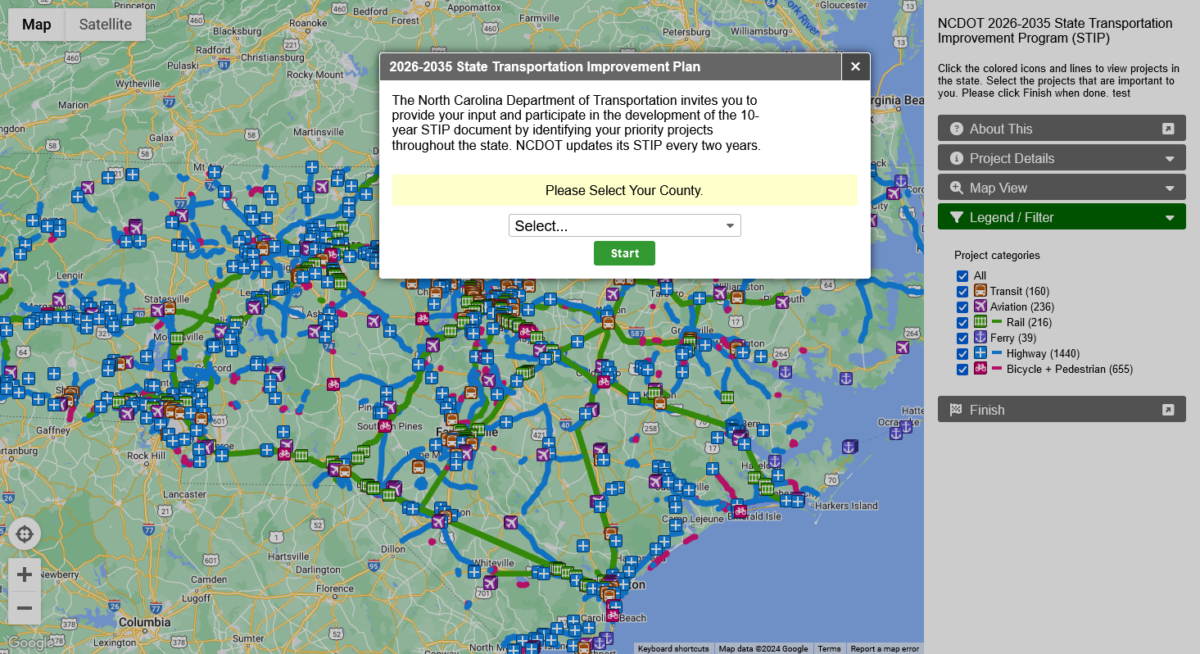
- A popup window will ask you to choose your county. Type in your county, click “submit” and then zoom to that area of the map
- Go to the panel on the right, and open the Legend/Filter dropdown menu and choose the categories you want to see at the same time. You can look at the bike/pedestrian (red), the Highway (blue) and the Transit (bus icon) projects all at once, or one category at a time if you like. (see image 1)
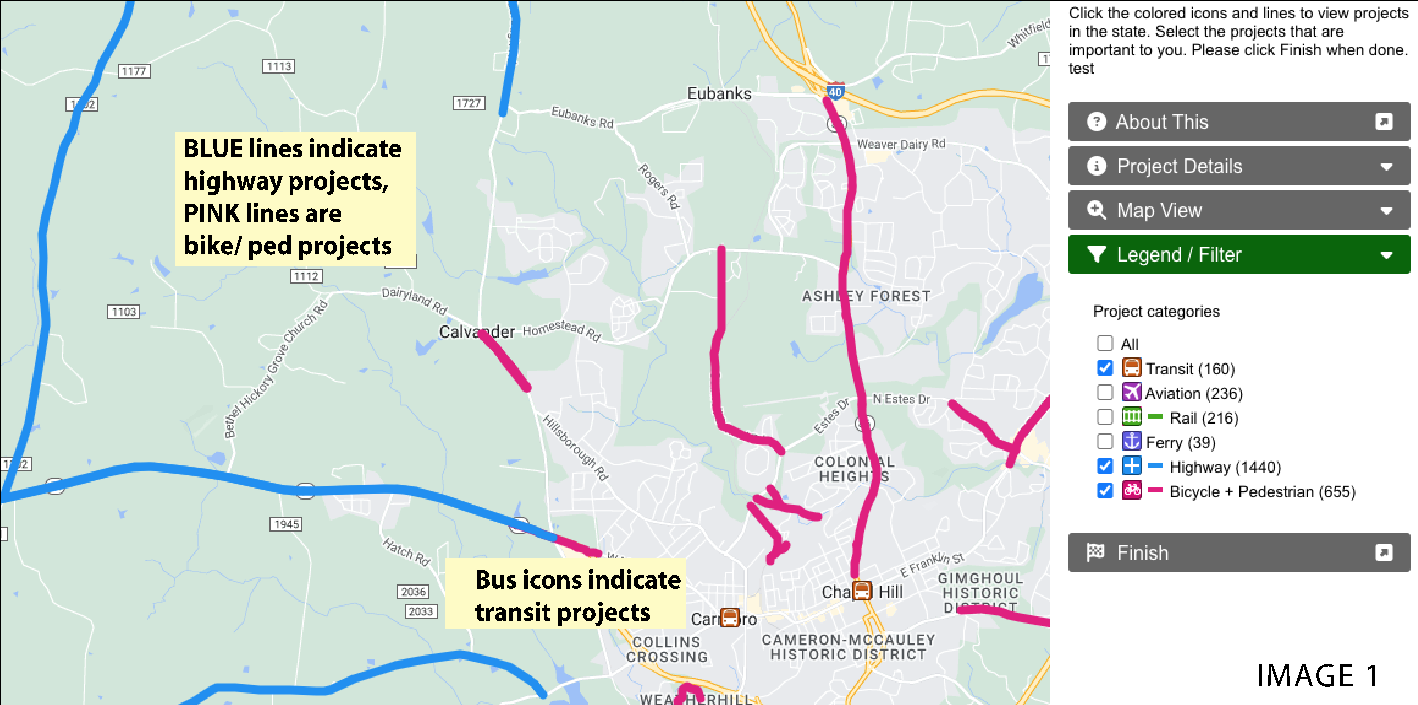
- Click on a project. That project line will then turn gray, and a description of the project will pop up. On my sample below, I have clicked a Bike/Ped project: a continuation of the East Franklin sidepath. There is a small eye that goes over the project(s) you are viewing or have already viewed, and the line of the one you have highlighted turns gray. Under “Project Details,” you can find the estimated cost of the project. (see image 2)
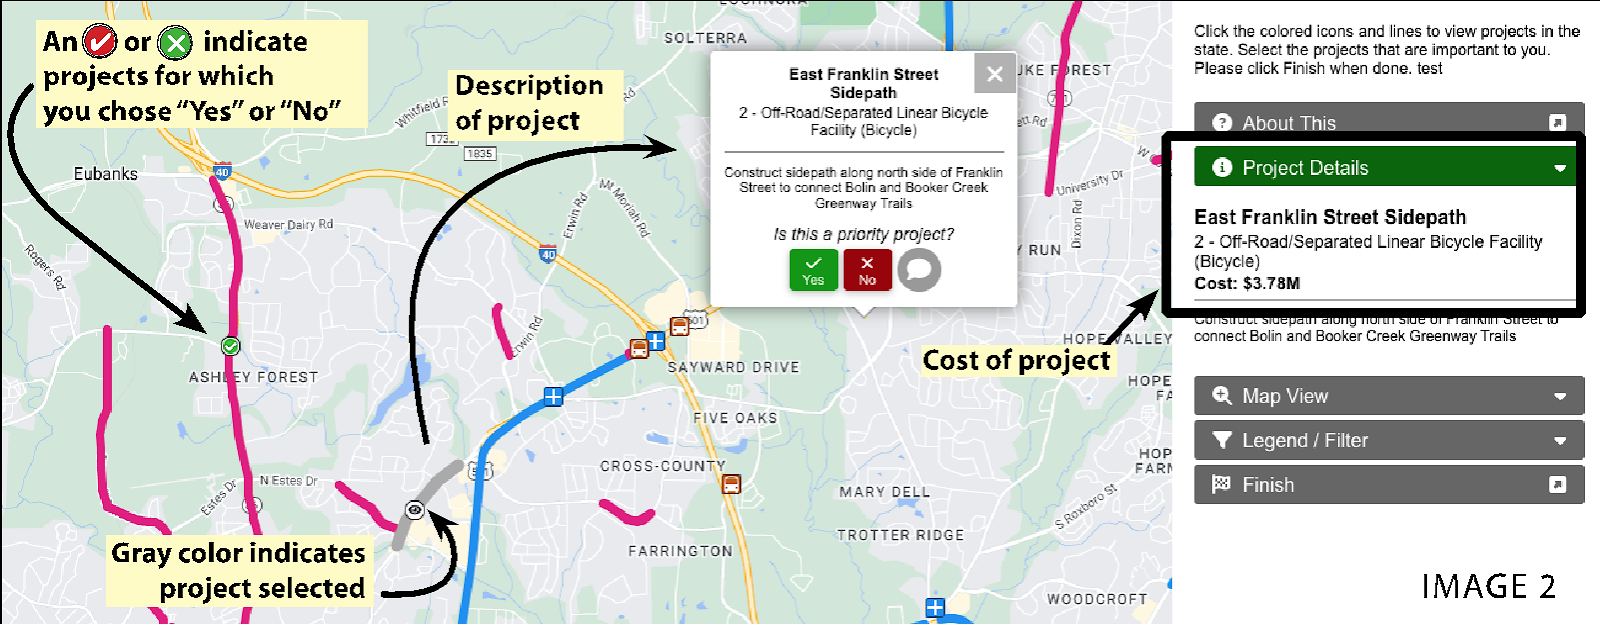
- You will notice that intersection projects are quite expensive. As an example, to redo the interchange at 15-501 and I-40 will cost a whopping $277.6 million! (see image 3)
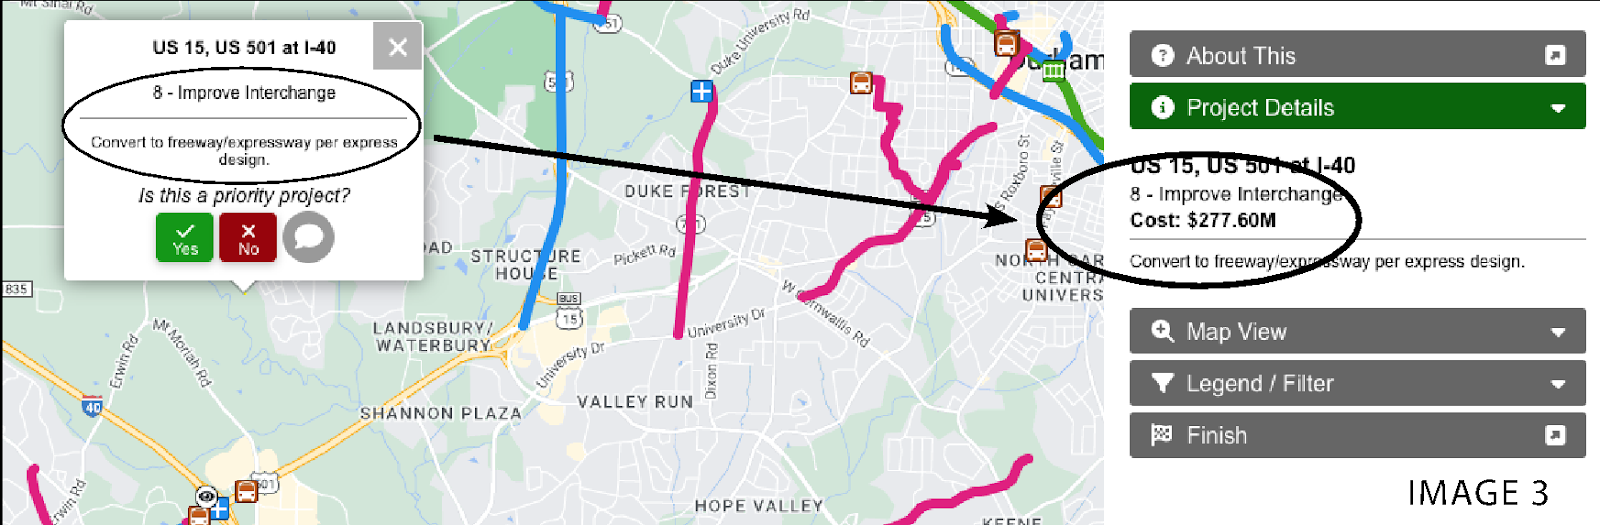
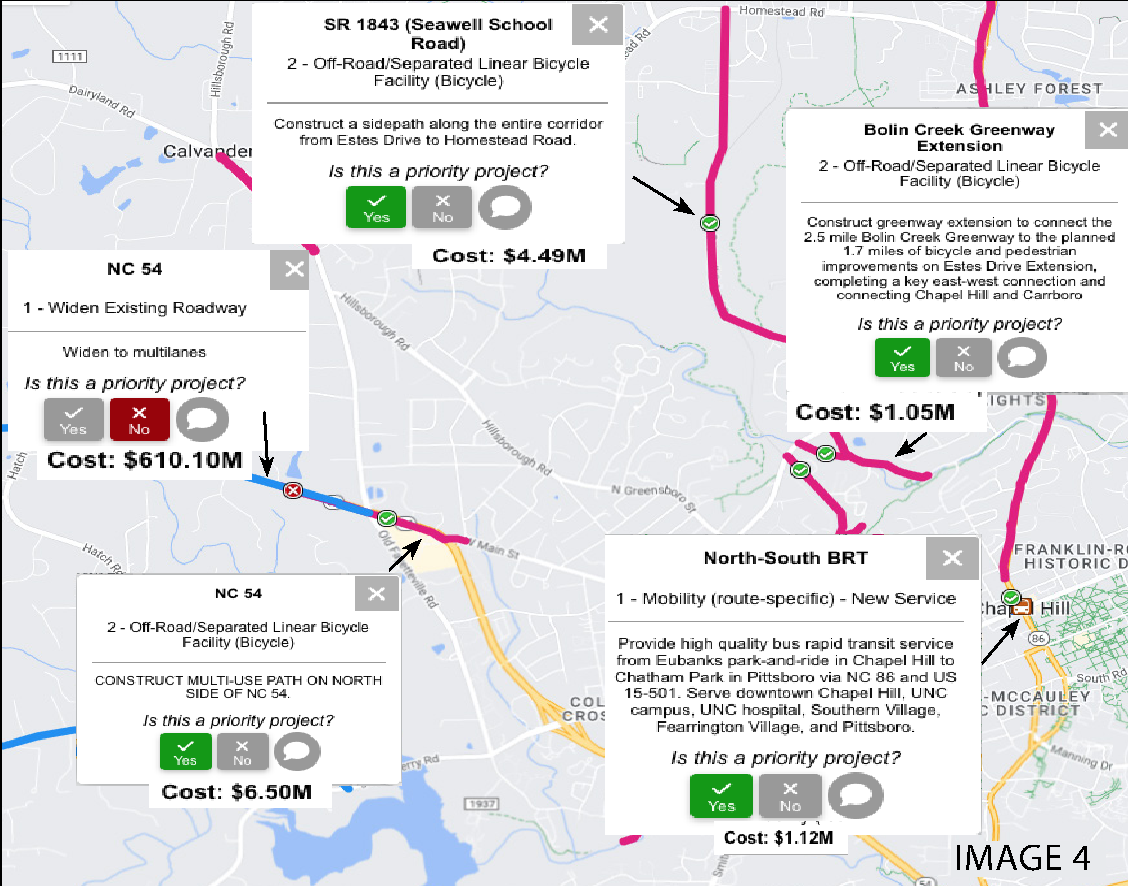
- You don’t have to vote or give comment on every project. But the more feedback the NCDOT receives, the better. In the example below, I have shown some of the projects I have said yes and no to. I offered comments in the comments section for some to explain my choices (this is optional). For example, on the Seawell Scholl Road separated bike path, I commented on the three schools and the Carolina North access points that exist along this corridor. Against the road widening of NC 54, I made the comments I listed earlier (see image 4).
- Lastly, and this is important, after you have made all of your comments, first click on “Finish” on the right side of the screen. A pop-up window will ask for some optional information which you can answer or leave blank. Either way, when you have finished, you MUST click on the FINISH in the pop-up window! If you don’t, your answers will not be recorded!
To learn more about a specific project, the very large prioritization list excel file has information about each one (there are separate sheets for each category—tabs are at the bottom), including what funding it is eligible for, its quantitative scoring, state dollars needed, federal dollars assigned, and more. You can access the file here, but you may find it easiest to download it before trying to open it. It will take a while to open. Once downloaded, you can sort each sheet by county or other criteria.
I have created a seven minute video that will walk you through the process. It can be found here: