
Each year, the Chamber for a Greater Chapel Hill-Carrboro presents a State of the Community Report, an annual presentation to local leaders that shares the latest demographic, economic, educational and environmental data for Orange County and our municipalities.
You can find the databooks for 2021, 2022, and 2023 on the Chamber website. They’re fascinating documents, presenting relevant facts and figures around housing, taxes, growth, demographics, school systems and more – and the data is often broken down with details for Hillsborough, Chapel Hill and Carrboro.
If there’s anything I like more than data, it’s facts – and this meeting and presentation is chock-full of them. Here are 11 things I learned from the most recent databook. (The images in this post are from the databook, which you can read in full here.)
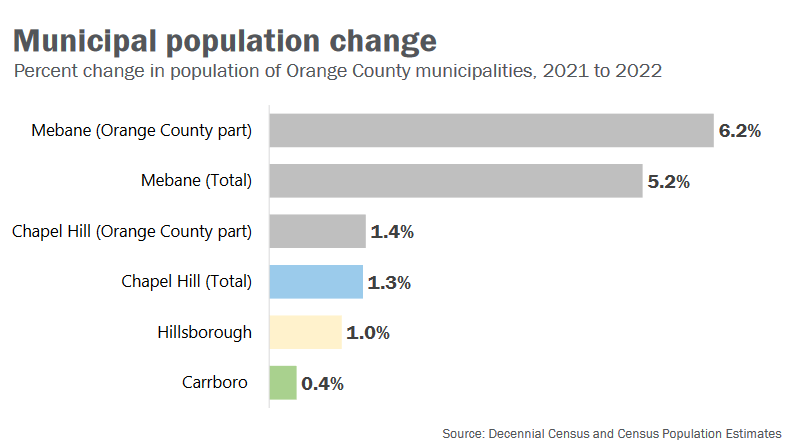
1. Carrboro and Chapel Hill are growing very slowly. From 2021 to 2022, Carrboro only had a numeric population change of 81 people. This is a growth rate of .4% compared to Orange County at 1.3%
In comparison, Chatham County (the home of Pittsboro and Siler City) has grown 2.2% – and is one of the fastest growing counties in the state. This brings both positives (more commercial businesses adding tax revenue) and negatives (many of the developments are sprawling and car-centric, and forests have been clear cut to make them, which (as President Obama has noted) is not good for our climate.)
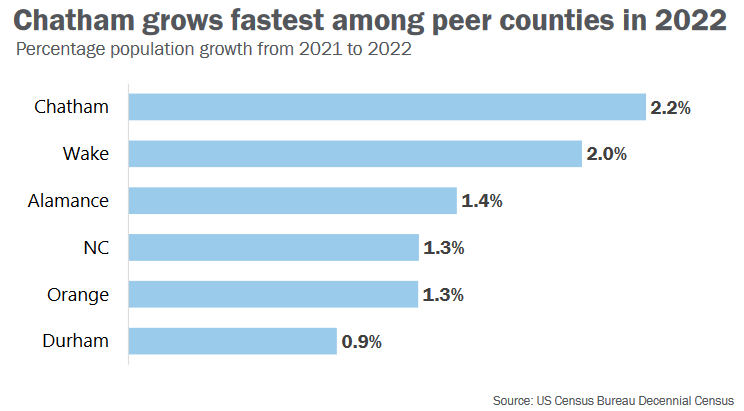
A brief note about Wake County: they grew 2 percent, but that’s a jump of 22,664 people, while Chatham County grew by 1,753 people. That’s because Wake County is the largest county by population in the state. I like to look at both numeric and percentage increases to tell a more complete story about how a population is changing.
2. Fewer than 10% (9.35%) of workers live and work in Chapel Hill. The rest drive in or out of Chapel Hill.
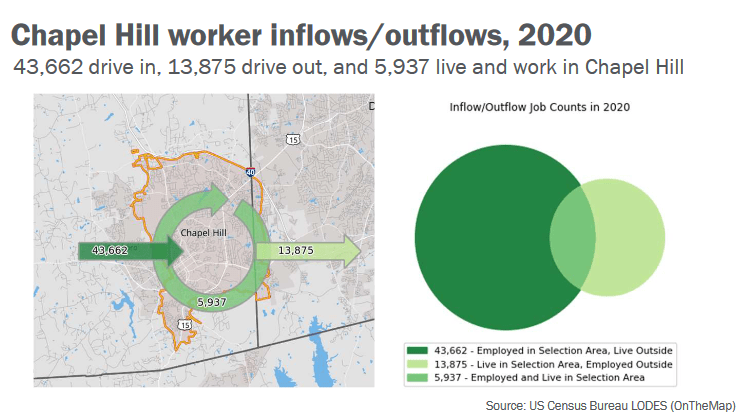
Building more housing – and more types of housing – will increase the number of people who can live and work in Chapel Hill. This is better for the environment – shorter commutes – and for people’s health and well-being.
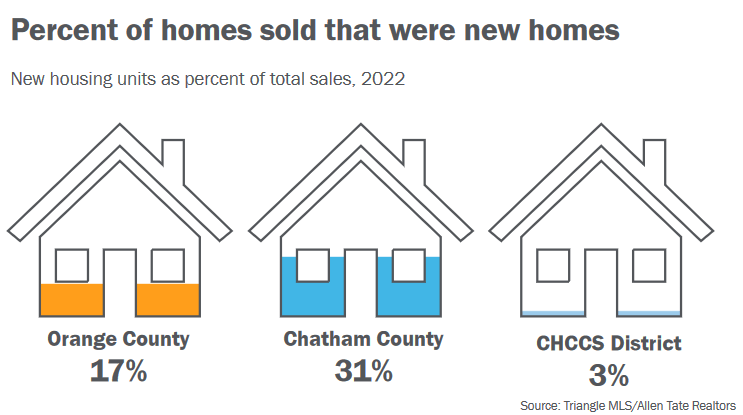
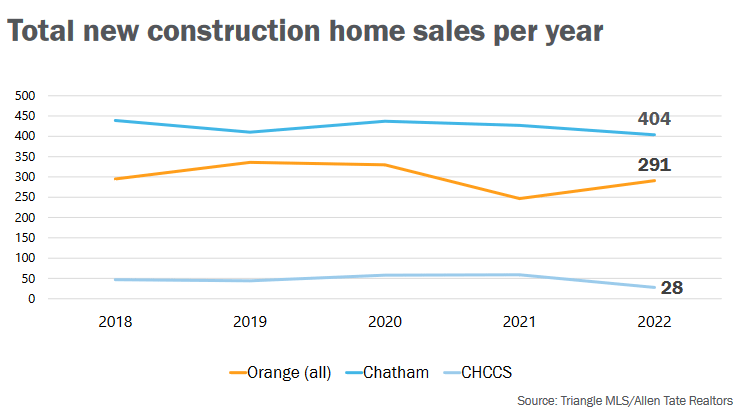
Also noteworthy: only three percent of the homes sold within the Chapel Hill-Carrboro City School district in 2022 were new builds. This is substantially lower than nearby communities. This will likely start to change as neighborhoods in Chapel Hill and Carrboro reach the end of their lifespan. We can already see older homes in neighborhoods being flipped into McMansions; my hope is that we allow for housing in Carrboro’s downtown mill neighborhood like duplexes or quads which will provide housing for senior citizens and single people who are likely not looking for huge houses. (Chapel Hill passed duplexes last year.)
Another striking stat: on average since 2018, the CHCCS district has only created 28 new for-sale homes per year. So most new residents who purchase a home are occupying previously occupied homes.
When I got my haircut recently, I learned that the person who cut my hair commutes in from Virginia, specifically citing the lack of affordable options in Chapel Hill as a reason. I asked if they would they like to live closer to their workplace? They answered, Yes!
3. The Chapel Hill Carrboro City School (CHCCS) District has also seen the largest dollar change in median home sales prices from 2020 to 2023, an increase of 50% ($206,000) over only three years. Carrboro sits at 51% ($200,550) and Chapel Hill at 48% ($190,000).
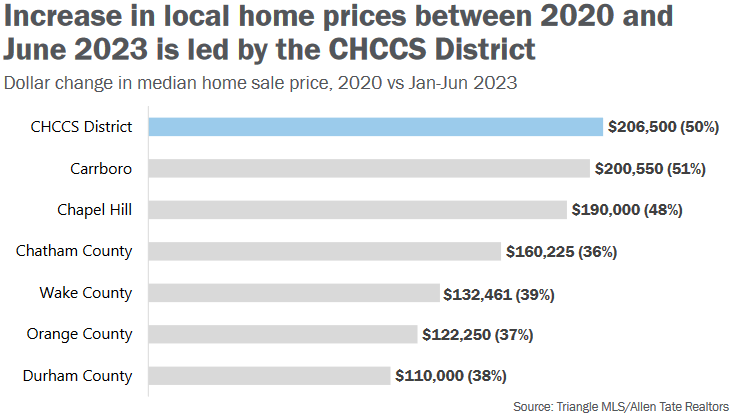
Compare this with Chatham County who has been supplying 14 times more new homes on average since 2018, they experienced an increase of only 36% ($160,225)
This means that if you want to buy a home in the CHCCS school district, you have to bring an extra $206,000 with you than if you had purchased in 2020. That’s a really large increase and limits the economic diversity of both Chapel Hill and Carrboro — and changes the makeup of who can afford to move here.
4. The average adjusted gross income of those leaving Orange County is less than those moving in.
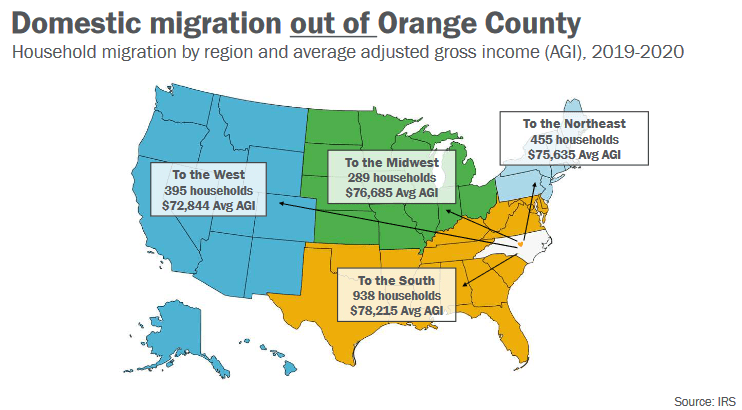
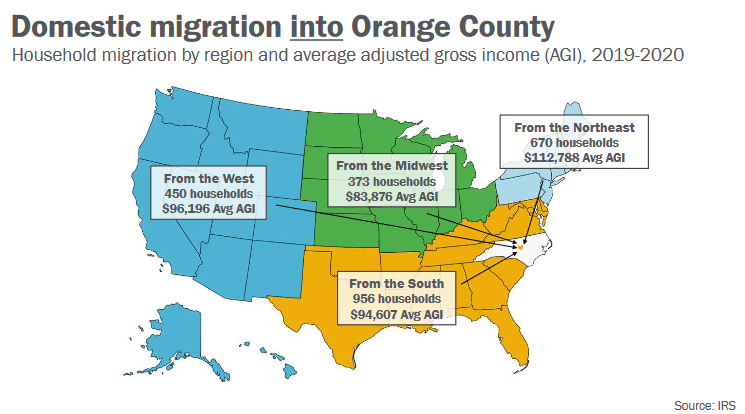
Average incomes are ~28% greater for people moving in than moving out, and in some geographies where they are relocating from this rises to ~50%. We are importing the wealthy, and often the ultra wealthy when compared to average incomes across the U.S.
5. Orange County opened 100 new restaurants in 2023, with 52 closures.
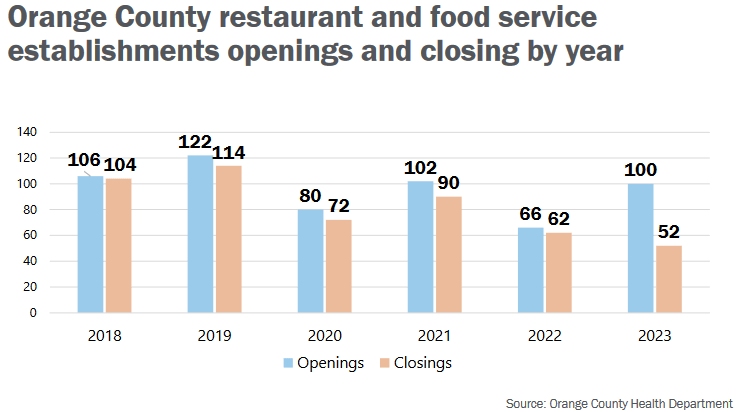
I’m thinking of this today with the announcement that Linda’s – an institution on Franklin Street for almost 50 years – will be closing, along with Basecamp, which opened in 2022. But I don’t see a noticeable pattern of more closures during the pandemic, which may be a result of PPP loans and the great work that our community did by creating Carrboro United to safely provide contactless pickup from a variety of restaurants.
6. There is still a large achievement gap in our school district.
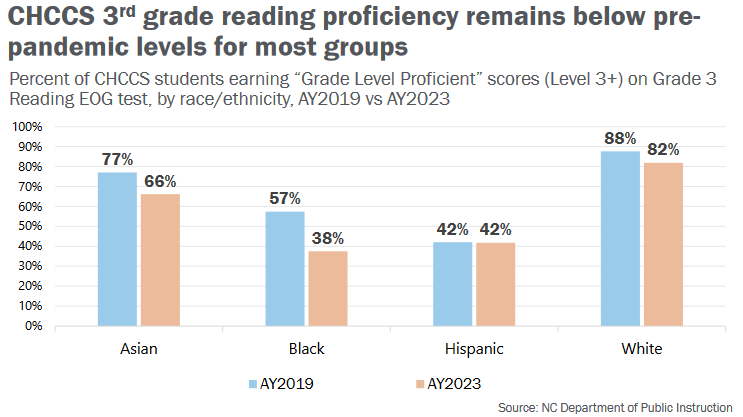
Chapel Hill has the second largest achievement gap in the country, according to a 2018 Stanford study. As you can see in the graph above, the percentage of “Grade Level Proficient” students in 3rd grade has dropped from 88% to 82% for white students at the same time as it’s dropped from 57% to 38% for black students. So that gap has increased from 31 percentage points (88% – 57%) to 44 percentage points (82% – 38%)! The percentage of Grade Level Proficient students stayed steady at 42% for Hispanic students. There was a decline in reading proficiency across all groups during the pandemic, though that number has started to rebound for most groups.
7. Municipal tax rates vary widely.
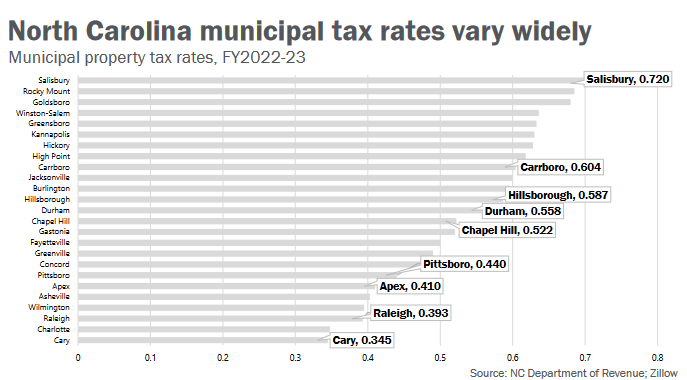
The highest rate in the state is in Salisbury. Carrboro clocks in 9th (.604) and Chapel Hill clocks in at 14th (.522) using data from 2022-23. We also pay county tax and a special school district tax which increases the rates.
8. We have a lot of dentists.
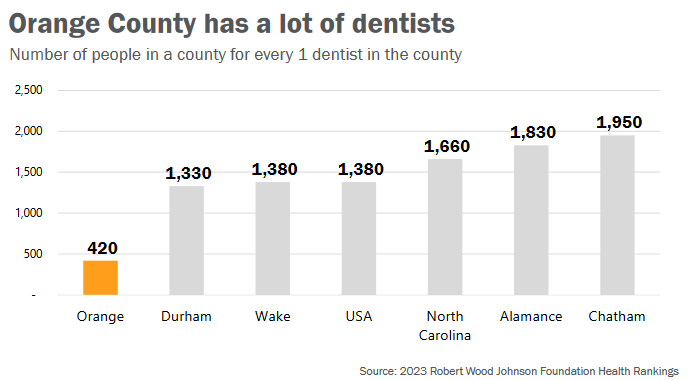
Roughly 4 out of 5 people would agree with me, I think.
9. Many of us have short commutes.
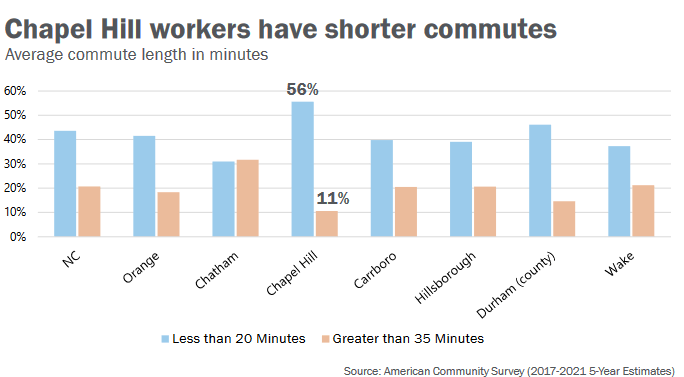
We also have a greater percentage of residents who report taking public transportation to work. (11% in Carrboro and 8% in Chapel Hill, compared to 1% in North Carolina as a whole.)
10. We’re using much less water, thanks to technology.
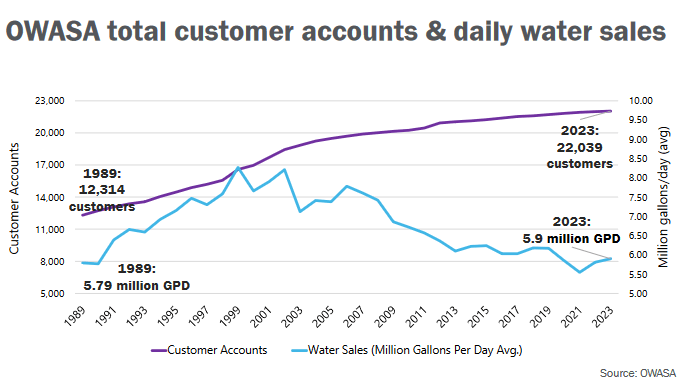
Back in the 70s and 80s, there were fears that we would run out of water. There were some major droughts in our area and behavioral changes, tiered pricing (that charge more based on how much water you use) and the reclaimed water facility used at UNC have all resulted in our community using much less water than at our peak. This is despite the customer base growing.
11. There’s a ton of people going downtown.
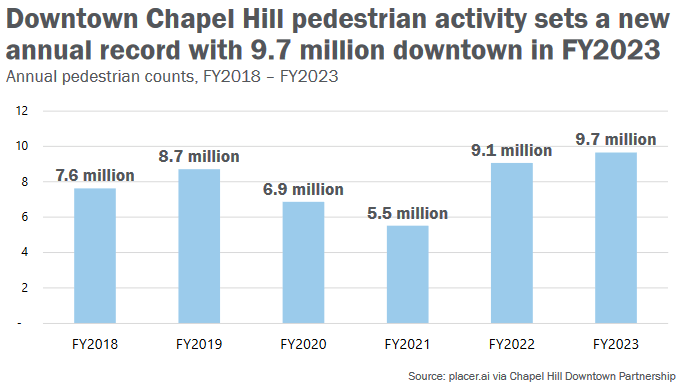
On social media, you’ll often see laments for our downtown, with many people saying that they don’t know who goes downtown anymore. Turns out, a lot of people go downtown.
Thank you to The Partnership for a Greater Chapel-Hill Carrboro for publishing this databook and collecting such good data about our community. This piece has been updated to clarify the achievement gap analysis.