The phrase “5000 housing units in the pipeline” has been popping up in CHALT-related material recently. (CHALT stands for the Chapel Hill Alliance for a Livable Town. They’re an “anti-development community group” that has “opposed nearly every major development proposal” in Chapel Hill since its inception in 2014/2015. They formed a PAC in 2017. The organization recruits and endorses candidates and sends out campaign mailers.)
We’ve seen it on NextDoor, in their newsletter, and in CHALT-authored op-eds. Three of CHALT’s coordinators have mentioned this mysterious 5000 unit figure in the past week. It’s on the Save Chapel Hill website.
Not only is the number dead wrong, it’s completely misleading.
Let’s dig in, friends.
The source of CHALT’s latest misinformation campaign
When spreading the “5000” figure, CHALT has shared a document called “Active Development Applications” from March 10, 2023. You can see the document here. It was given to members of the Environmental Services Advisory Board (ESAB). The Treasurer of the CHALT PAC is the current head of the ESAB.
Let’s orient ourselves. This is a legit document – it’s from the town of Chapel Hill – but the document doesn’t show units in the housing development pipeline in Chapel Hill.
Instead, it shows all active development applications, from a gas station to the Dunkin Donuts drive-through to the Chapel Hill transit expansion, to housing concept plans that haven’t even gotten financing yet.
Let’s throw out the non-housing applications and just focus on the applications that are housing-related.
What’s the difference between applications and what’s in a housing development pipeline?
An analogy: You apply to 10 colleges. You get into 2 colleges. You’re now in the pipeline for 2 colleges, not 10.
That’s the way housing pipelines work too. The “active development applications” sheet shows every project – from concepts that will never get built to concepts that will linger for years to every affordable housing unit Chapel Hill has recently approved to projects still in the planning phase to projects that will be built after years and years of moving through the phases.
Oh. So this document shows some concepts that will never move beyond that stage and CHALT is counting those as being in the development pipeline?
That’s right. The town gets lots and lots of applications for concepts – some of which will not be financed or move beyond the concept phase.
Oh. So how should we define a development pipeline?
A housing development pipeline is generally defined as: the inventory of development projects that have been approved by a Town Council but not yet built. In other words, housing units that a Town Council has approved and are in progress and/or waiting to get started.
With that definition, which is the one that basically every municipality and housing-related institution across the United States uses, how many units are in Chapel Hill’s development pipeline?
Using that definition, there are currently between 1277 and 1292 units in Chapel Hill’s development pipeline, as of March 2023. We are including all projects approved by council, waiting for final plans submissions, under staff review, and that have started construction.
This number includes at least 323 affordable housing units that have been years and years in the making, as well as 157 townhomes.
There also appears to be a discrepancy with the units listed for Lullwater property – the document says 489 whereas the Town of Chapel Hill website about the project says 337. We have used 489 in our calculations – however, if the Town of Chapel Hill page is accurate, then there are between 1125 and 1140 units in the pipeline.
Also, not all of those units will be built for people in 2023 so this represents 3-5 years worth of housing – and some of them started years ago.
So nowhere near 5000?
No.
If you add up all of the applications, do you get 5,000?
Nope, not even then. If you are overly charitable and postulate that every single application from the March 2023 document will be built (spoiler: they won’t) you get 4,140 units. That’s a lot less than 5000. Even then, some of those units aren’t projected to be built until 2028.
Any caveats?
Council just rejected a 112-unit building so there’s no guarantee than any of the projects not yet approved will be. There may be applications or projects not on this list – however, this list is the source for the claim, so it’s what we’re using.
So why are they saying 5000 units?
Probably to scare people and because no one fact checks this stuff.
So, I’ve got another question. Is 1277-1292 units a lot or a little?
This is really the key question. First, we don’t like smushing all units together as one number: Many of these units are years in the making, some are apartments, some are town houses, and some are affordable homes. Some are aimed at medical students and residents, others at people much older. It’s more like, a few years of housing of all types smushed together.
We also prefer percentages over units, because units tell us nothing without comparison.
1277 units is slightly less than a 5.7% increase in overall units. (As of December 21, 2022, there were 22,152 total housing units in town – there are slightly more now, but those numbers are reported out quarterly.)
BUT many of those units in the pipeline won’t get built this year – some are slated to be built in 2024, 2025, 2026, and 2028. So the number of new units coming out each year is a lot less than 1277 and much more in line with what Rod Stevens suggested the town needs.
Who the heck is Rod Stevens?
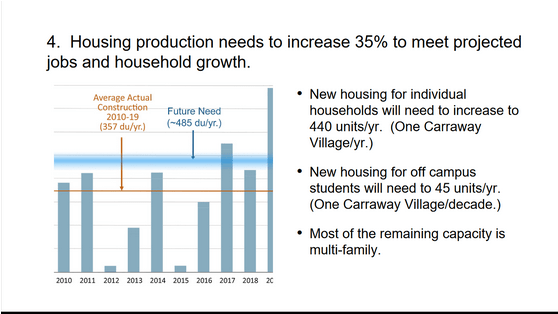
Rod Stevens wrote an often-quoted report for the town in 2021 on Projected Housing Needs. To keep the current jobs/housing ratio, Stevens’ estimated that Chapel Hill should add around 485 units per year. Again, that’s to maintain the ratio – not increase it.
Funnily enough, Stevens also noted this: “Jobs, not students, drive most of the demand for new housing. Chapel Hill has the highest ratio of jobs to housing in the region.” He also noted:

Stevens’ also noted that in some years Chapel Hill builds a lot less than that and some years more. In the 2010s, Chapel Hill underbuilt. You can see a graph of that here:

How many units should be in the pipeline at a given time?
This is a good question, and it depends on a number of factors, like population growth across the state and region. Chapel Hill is projected to grow, much like towns across the state in areas with good jobs. (Other areas that are growing besides the Triangle include Wilmington and Charlotte.)
One way to look at this is to examine how much growth Chapel Hill has had.
Chapel Hill added 3170 housing units during the 2000s and 3,574 during the 2010s.
As of 2021, Orange County added 14,783 residents since 2010, less than 1K below the numeric population growth of the 2000s (15,574). As of 2018, Hillsborough’s growth rate was 9.5%. This was 0.6 percentage points greater than Carrboro and 2.9 percentage points above Chapel Hill. (Hillsborough has a much smaller population, numbers wise.)
Among the core Triangle counties, Orange County has grown the slowest since 2010: Wake County has grown more than twice as quickly as Orange (23.4%) while Durham County’s growth rate is 8.0 percentage points higher than Orange’s.
What about other college towns?
Let’s take a look. Madison, Charlottesville, Athens, Bloomington, Bozeman and Burlington grew faster than Chapel Hill; Berkeley, Boulder were slower. Ann Arbor had the same rate of growth.
| City | State | Housing Units (2010) | Housing Units (2020) | Change | Rate of Change |
|---|---|---|---|---|---|
| Chapel Hill | NC | 22254 | 23713 | 1459 | +7% |
Flagstaff | AZ | 26254 | 31369 | 5115 | +19% |
| Berkeley | CA | 49454 | 52331 | 2877 | +6% |
| Boulder | CO | 43479 | 46289 | 2810 | +6% |
| Athens | GA | 50475 | 55195 | 4720 | +9% |
| Bloomington | IN | 33239 | 36454 | 3215 | +10% |
| Ann Arbor | MI | 49789 | 53213 | 3424 | +7% |
| Bozeman | MT | 17464 | 23535 | 6071 | +35% |
| Burlington | VT | 16897 | 18282 | 1385 | +8% |
| Charlottesville | VA | 19189 | 21413 | 2224 | +12% |
| Madison | WI | 108843 | 126070 | 17227 | +16% |
What about similarly sized NC cities?
There are 10 cities in NC between 50-100k population. Only one (Rocky Mount) lost population. Of the rest, Chapel Hill has grown the least over the past decade.
| 2010 housing units | 2020 | change | rate | ||
| Apex | 13922 | 22151 | 8229 | 59% | |
| Asheville | 41626 | 47606 | 5980 | 14% | |
| Burlington | 23414 | 25771 | 2357 | 10% | |
| Chapel Hill | 22254 | 23713 | 1459 | 7% | |
| Gastonia | 31238 | 34346 | 3108 | 10% | |
| Greenville | 40564 | 45147 | 4583 | 11% | |
| Huntersville | 18477 | 23962 | 5485 | 30% | |
| Jacksonville | 21135 | 24004 | 2869 | 14% | |
| Kannapolis | 18645 | 21963 | 3318 | 18% | |
| Rocky Mount | 26953 | 26168 | -785 | -3% |
Stephen Whitlow helped a lot with this piece!
